29
/
en
AIzaSyAYiBZKx7MnpbEhh9jyipgxe19OcubqV5w
April 1, 2024
37461
IDA & IBRD total
IBT
false
2
1
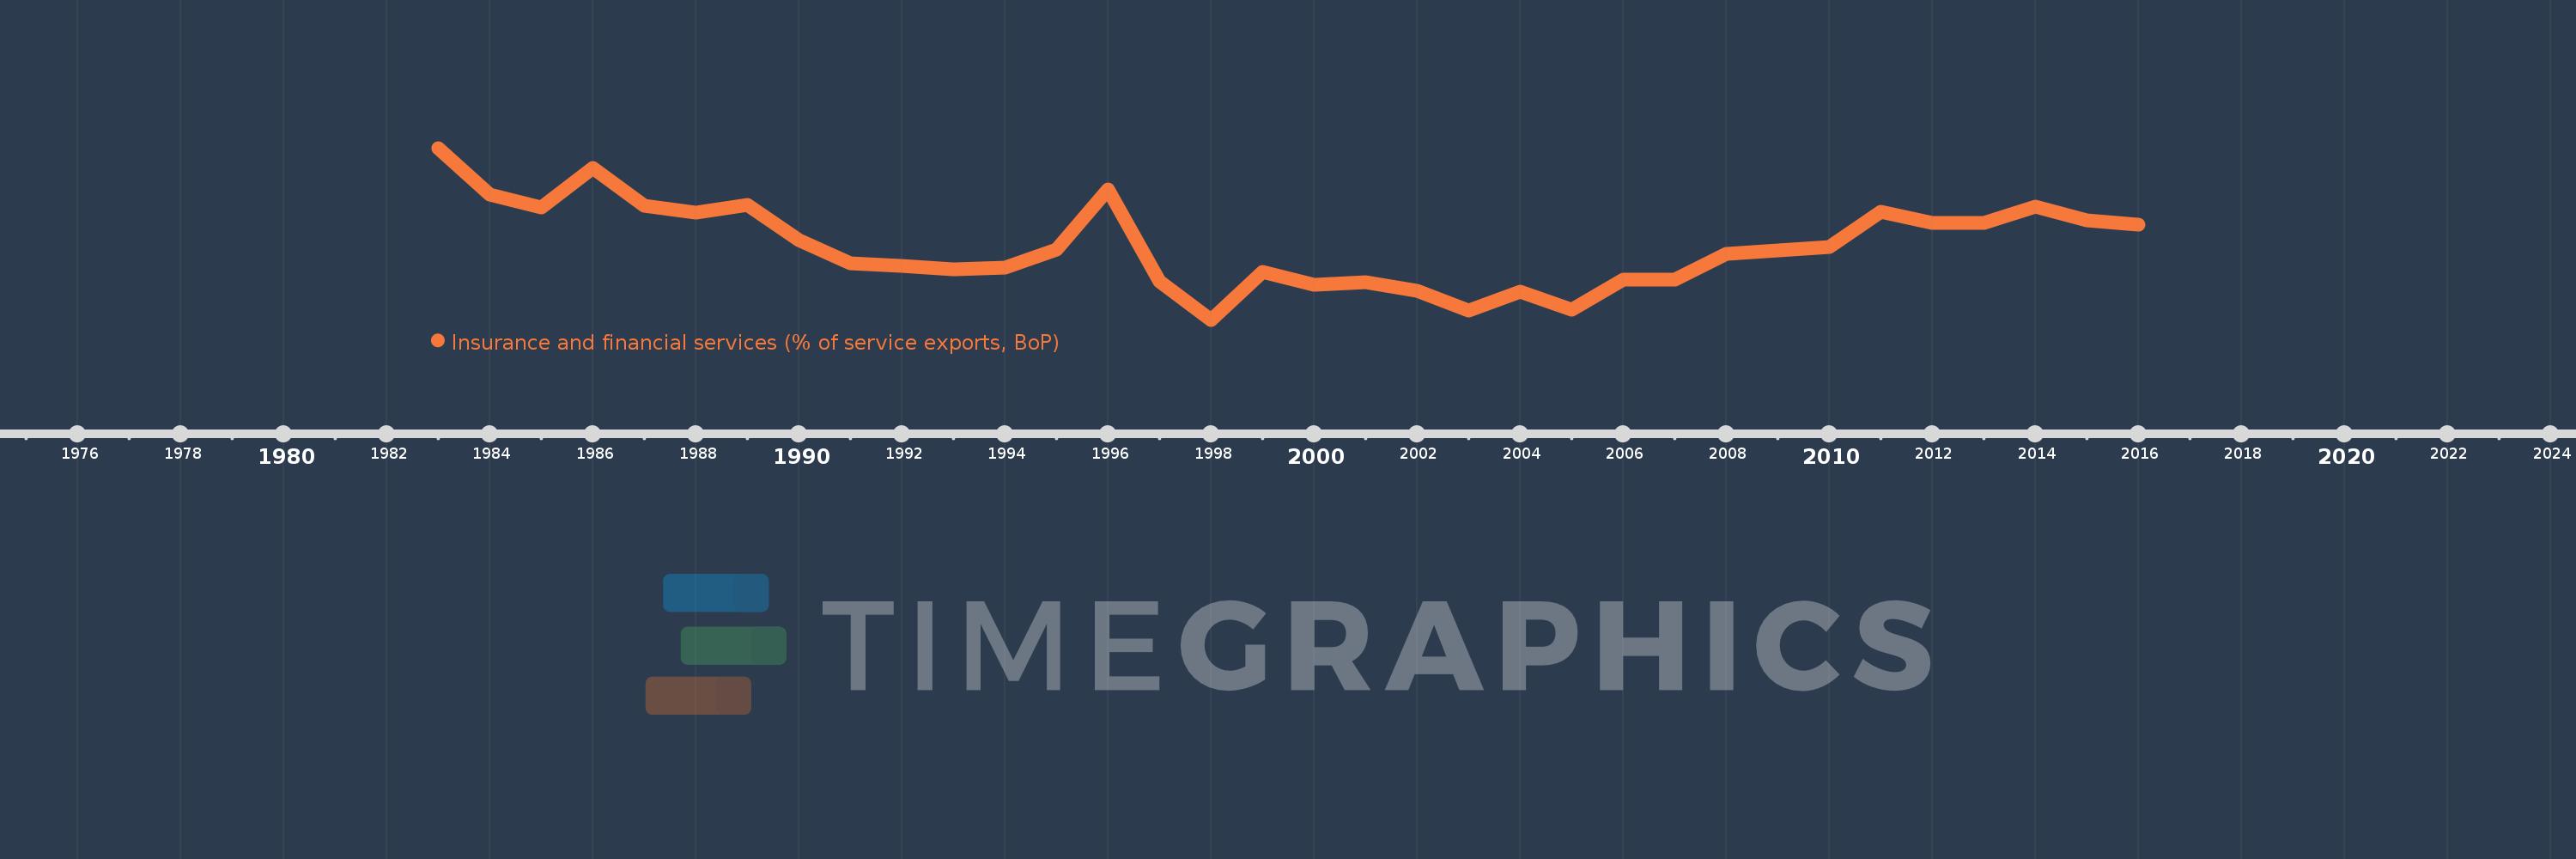
Insurance and financial services (% of service exports, BoP)
2016,2015,2014,2013,2012,2011,2010,2009,2008,2007,2006,2005,2004,2003,2002,2001,2000,1999,1998,1997,1996,1995,1994,1993,1992,1991,1990,1989,1988,1987,1986,1985,1984,1983
This statistics in other country:
AfghanistanAlbaniaAlgeriaAngolaAntigua and BarbudaArab WorldArgentinaArmeniaArubaAustraliaAustriaAzerbaijanBahrainBangladeshBarbadosBelarusBelgiumBelizeBeninBermudaBhutanBoliviaBosnia and HerzegovinaBotswanaBrazilBrunei DarussalamBulgariaBurkina FasoBurundiCabo VerdeCambodiaCameroonCanadaCaribbean small statesCentral African RepublicCentral Europe and the BalticsChadChileChinaColombiaComorosCongo, Dem. Rep.Congo, Rep.Costa RicaCote d'IvoireCroatiaCuracaoCyprusCzech RepublicDenmarkDominicaDominican RepublicEarly-demographic dividendEast Asia & PacificEast Asia & Pacific (excluding high income)East Asia & Pacific (IDA & IBRD countries)EcuadorEgypt, Arab Rep.El SalvadorEritreaEstoniaEthiopiaEuro areaEurope & Central AsiaEurope & Central Asia (excluding high income)Europe & Central Asia (IDA & IBRD countries)European UnionFaroe IslandsFijiFinlandFragile and conflict affected situationsFranceFrench PolynesiaGabonGambia, TheGeorgiaGermanyGhanaGreeceGrenadaGuatemalaGuineaGuinea-BissauGuyanaHaitiHeavily indebted poor countries (HIPC)High incomeHondurasHong Kong SAR, ChinaHungaryIBRD onlyIcelandIDA & IBRD totalIDA onlyIDA totalIndiaIndonesiaIran, Islamic Rep.IraqIrelandIsraelItalyJamaicaJapanJordanKazakhstanKenyaKiribatiKorea, Rep.KosovoKuwaitKyrgyz RepublicLao PDRLate-demographic dividendLatin America & Caribbean Latin America & Caribbean (excluding high income)Latin America & the Caribbean (IDA & IBRD countries)LatviaLeast developed countries: UN classificationLebanonLesothoLiberiaLibyaLithuaniaLow & middle incomeLow incomeLower middle incomeLuxembourgMacao SAR, ChinaMacedonia, FYRMadagascarMalawiMalaysiaMaldivesMaliMaltaMauritaniaMauritiusMexicoMiddle East & North AfricaMiddle East & North Africa (excluding high income)Middle East & North Africa (IDA & IBRD countries)Middle incomeMoldovaMongoliaMontenegroMoroccoMozambiqueMyanmarNamibiaNepalNetherlandsNew CaledoniaNew ZealandNicaraguaNigerNigeriaNorth AmericaNorwayOECD membersOmanOther small statesPacific island small statesPakistanPalauPanamaPapua New GuineaParaguayPeruPhilippinesPolandPortugalPost-demographic dividendPre-demographic dividendQatarRomaniaRussian FederationRwandaSamoaSao Tome and PrincipeSaudi ArabiaSenegalSerbiaSeychellesSierra LeoneSingaporeSint Maarten (Dutch part)Slovak RepublicSloveniaSmall statesSolomon IslandsSouth AfricaSouth AsiaSouth Asia (IDA & IBRD)South SudanSpainSri LankaSt. Kitts and NevisSt. LuciaSt. Vincent and the GrenadinesSub-Saharan Africa Sub-Saharan Africa (excluding high income)Sub-Saharan Africa (IDA & IBRD countries)SudanSurinameSwazilandSwedenSwitzerlandSyrian Arab RepublicTajikistanTanzaniaThailandTimor-LesteTogoTongaTrinidad and TobagoTunisiaTurkeyTuvaluUgandaUkraineUnited KingdomUnited StatesUpper middle incomeUruguayVanuatuVenezuela, RBWest Bank and GazaWorldZambiaZimbabwe Timeline:
This timeline shows a graph from 1983 to 2016 of IDA & IBRD total. No data until 1982. Number of actual observations by date: 34.
Source name:
World Development Indicators
Source organization:
International Monetary Fund, Balance of Payments Statistics Yearbook and data files.
Categories, topics:
Economy & Growth, Private Sector, Trade
Last updated:
apr 23, 2017
Indicators value changes by year
At the date of observation
Value
Absolute change
Change from previous value
jan 1, 1983
4.686
+4.686
0.0%
jan 1, 1984
3.932
-0.754
-16.1%
jan 1, 1985
3.709
-0.223
-5.67%
jan 1, 1986
4.356
+0.647
17.45%
jan 1, 1987
3.737
-0.619
-14.2%
jan 1, 1988
3.625
-0.112
-3.0%
jan 1, 1989
3.754
+0.129
3.56%
jan 1, 1990
3.186
-0.568
-15.13%
jan 1, 1991
2.805
-0.381
-11.96%
jan 1, 1992
2.758
-0.047
-1.67%
jan 1, 1993
2.713
-0.045
-1.64%
jan 1, 1994
2.734
+0.021
0.78%
jan 1, 1995
3.026
+0.291
10.66%
jan 1, 1996
4.011
+0.985
32.56%
jan 1, 1997
2.511
-1.5
-37.39%
jan 1, 1998
1.885
-0.626
-24.93%
jan 1, 1999
2.666
+0.781
41.41%
jan 1, 2000
2.452
-0.214
-8.03%
jan 1, 2001
2.503
+0.051
2.07%
jan 1, 2002
2.356
-0.147
-5.86%
jan 1, 2003
2.029
-0.328
-13.9%
jan 1, 2004
2.337
+0.309
15.22%
jan 1, 2005
2.045
-0.292
-12.48%
jan 1, 2006
2.537
+0.492
24.04%
jan 1, 2007
2.534
-0.004
-0.14%
jan 1, 2008
2.953
+0.419
16.54%
jan 1, 2009
3.017
+0.064
2.18%
jan 1, 2010
3.068
+0.051
1.69%
jan 1, 2011
3.65
+0.582
18.98%
jan 1, 2012
3.466
-0.185
-5.06%
jan 1, 2013
3.469
+0.003
0.09%
jan 1, 2014
3.731
+0.262
7.56%
jan 1, 2015
3.507
-0.224
-6.0%
jan 1, 2016
3.431
-0.077
-2.18%
Ranking of countries by current statistics by years


Comments: