29
/
en
AIzaSyAYiBZKx7MnpbEhh9jyipgxe19OcubqV5w
April 1, 2024
123655
Ecuador
ECU
true
2
1
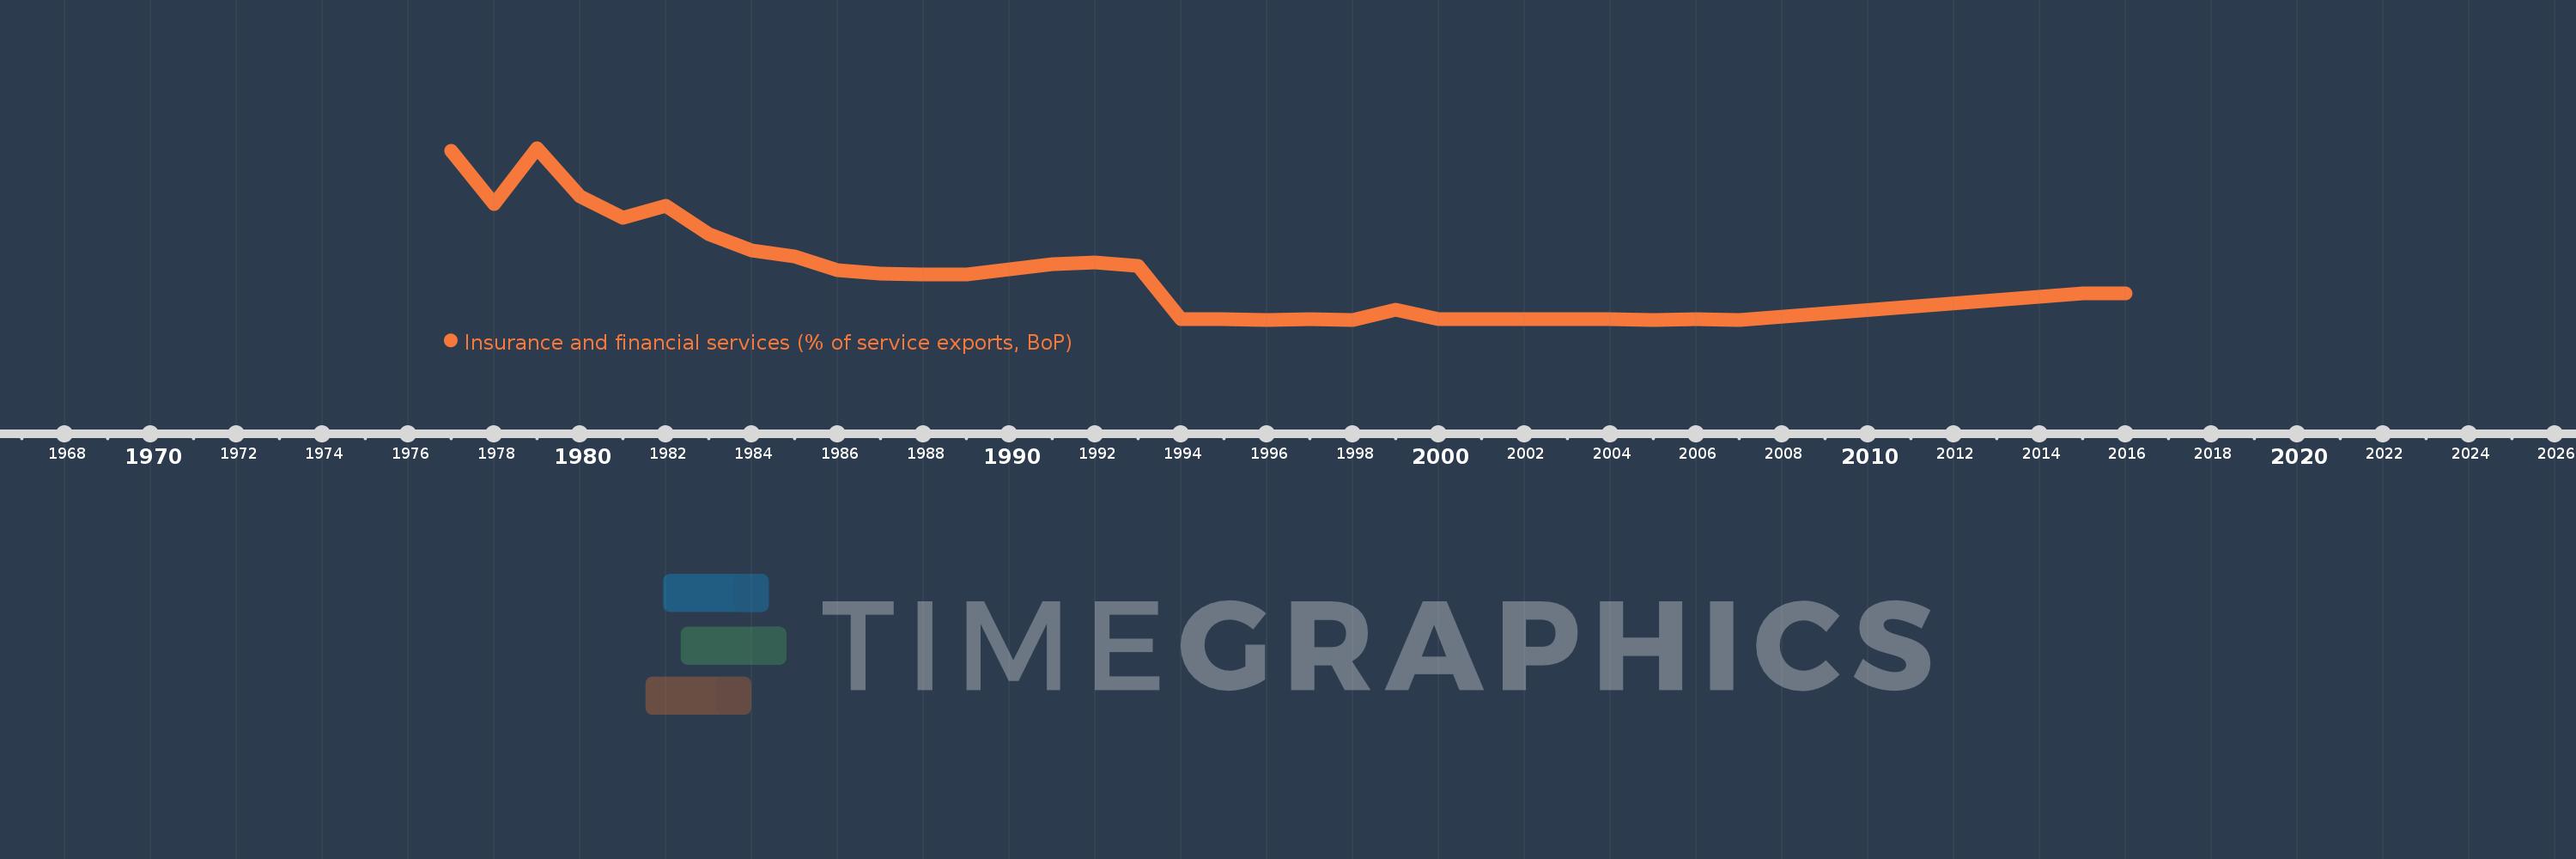
Insurance and financial services (% of service exports, BoP)
2016,2015,2007,2006,2005,2004,2003,2002,2001,2000,1999,1998,1997,1996,1995,1994,1993,1992,1991,1990,1989,1988,1987,1986,1985,1984,1983,1982,1981,1980,1979,1978,1977
This statistics in other country:
AfghanistanAlbaniaAlgeriaAngolaAntigua and BarbudaArab WorldArgentinaArmeniaArubaAustraliaAustriaAzerbaijanBahrainBangladeshBarbadosBelarusBelgiumBelizeBeninBermudaBhutanBoliviaBosnia and HerzegovinaBotswanaBrazilBrunei DarussalamBulgariaBurkina FasoBurundiCabo VerdeCambodiaCameroonCanadaCaribbean small statesCentral African RepublicCentral Europe and the BalticsChadChileChinaColombiaComorosCongo, Dem. Rep.Congo, Rep.Costa RicaCote d'IvoireCroatiaCuracaoCyprusCzech RepublicDenmarkDominicaDominican RepublicEarly-demographic dividendEast Asia & PacificEast Asia & Pacific (excluding high income)East Asia & Pacific (IDA & IBRD countries)EcuadorEgypt, Arab Rep.El SalvadorEritreaEstoniaEthiopiaEuro areaEurope & Central AsiaEurope & Central Asia (excluding high income)Europe & Central Asia (IDA & IBRD countries)European UnionFaroe IslandsFijiFinlandFragile and conflict affected situationsFranceFrench PolynesiaGabonGambia, TheGeorgiaGermanyGhanaGreeceGrenadaGuatemalaGuineaGuinea-BissauGuyanaHaitiHeavily indebted poor countries (HIPC)High incomeHondurasHong Kong SAR, ChinaHungaryIBRD onlyIcelandIDA & IBRD totalIDA onlyIDA totalIndiaIndonesiaIran, Islamic Rep.IraqIrelandIsraelItalyJamaicaJapanJordanKazakhstanKenyaKiribatiKorea, Rep.KosovoKuwaitKyrgyz RepublicLao PDRLate-demographic dividendLatin America & Caribbean Latin America & Caribbean (excluding high income)Latin America & the Caribbean (IDA & IBRD countries)LatviaLeast developed countries: UN classificationLebanonLesothoLiberiaLibyaLithuaniaLow & middle incomeLow incomeLower middle incomeLuxembourgMacao SAR, ChinaMacedonia, FYRMadagascarMalawiMalaysiaMaldivesMaliMaltaMauritaniaMauritiusMexicoMiddle East & North AfricaMiddle East & North Africa (excluding high income)Middle East & North Africa (IDA & IBRD countries)Middle incomeMoldovaMongoliaMontenegroMoroccoMozambiqueMyanmarNamibiaNepalNetherlandsNew CaledoniaNew ZealandNicaraguaNigerNigeriaNorth AmericaNorwayOECD membersOmanOther small statesPacific island small statesPakistanPalauPanamaPapua New GuineaParaguayPeruPhilippinesPolandPortugalPost-demographic dividendPre-demographic dividendQatarRomaniaRussian FederationRwandaSamoaSao Tome and PrincipeSaudi ArabiaSenegalSerbiaSeychellesSierra LeoneSingaporeSint Maarten (Dutch part)Slovak RepublicSloveniaSmall statesSolomon IslandsSouth AfricaSouth AsiaSouth Asia (IDA & IBRD)South SudanSpainSri LankaSt. Kitts and NevisSt. LuciaSt. Vincent and the GrenadinesSub-Saharan Africa Sub-Saharan Africa (excluding high income)Sub-Saharan Africa (IDA & IBRD countries)SudanSurinameSwazilandSwedenSwitzerlandSyrian Arab RepublicTajikistanTanzaniaThailandTimor-LesteTogoTongaTrinidad and TobagoTunisiaTurkeyTuvaluUgandaUkraineUnited KingdomUnited StatesUpper middle incomeUruguayVanuatuVenezuela, RBWest Bank and GazaWorldZambiaZimbabwe Timeline:
This timeline shows a graph from 1977 to 2016 of Ecuador. No data until 1976. Number of actual observations by date: 33.
Source name:
World Development Indicators
Source organization:
International Monetary Fund, Balance of Payments Statistics Yearbook and data files.
Categories, topics:
Economy & Growth, Private Sector, Trade
Last updated:
apr 23, 2017
Indicators value changes by year
Maximum:
26.954
jan 1, 1979
At the date of observation
Value
Absolute change
Change from previous value
jan 1, 1977
26.481
+26.481
0.0%
jan 1, 1978
18.088
-8.393
-31.69%
jan 1, 1979
26.954
+8.865
49.01%
jan 1, 1980
19.416
-7.538
-27.97%
jan 1, 1981
15.967
-3.449
-17.76%
jan 1, 1982
17.837
+1.87
11.71%
jan 1, 1983
13.438
-4.399
-24.66%
jan 1, 1984
10.825
-2.613
-19.44%
jan 1, 1985
9.966
-0.86
-7.94%
jan 1, 1986
7.809
-2.157
-21.65%
jan 1, 1987
7.256
-0.552
-7.07%
jan 1, 1988
7.126
-0.13
-1.8%
jan 1, 1989
7.045
-0.08
-1.13%
jan 1, 1990
7.946
+0.9
12.78%
jan 1, 1991
8.736
+0.79
9.95%
jan 1, 1992
8.993
+0.257
2.94%
jan 1, 1993
8.428
-0.565
-6.28%
jan 1, 1994
0.039
-8.389
-99.53%
jan 1, 1995
0.044
+0.005
12.87%
jan 1, 1996
0.024
-0.02
-44.89%
jan 1, 1997
0.149
+0.124
507.55%
jan 1, 1998
0.014
-0.134
-90.25%
jan 1, 1999
1.546
+1.532
10.57K%
jan 1, 2000
0.042
-1.504
-97.27%
jan 1, 2001
0.154
+0.111
263.67%
jan 1, 2002
0.087
-0.066
-43.1%
jan 1, 2003
0.048
-0.04
-45.44%
jan 1, 2004
0.093
+0.046
95.72%
jan 1, 2005
0.012
-0.081
-87.08%
jan 1, 2006
0.073
+0.061
505.73%
jan 1, 2007
0.001
-0.072
-98.95%
jan 1, 2015
4.085
+4.084
532.19K%
jan 1, 2016
4.15
+0.066
1.61%
Ranking of countries by current statistics by years


Comments: