29
/
en
AIzaSyAYiBZKx7MnpbEhh9jyipgxe19OcubqV5w
April 1, 2024
140545
Ghana
GHA
true
2
1
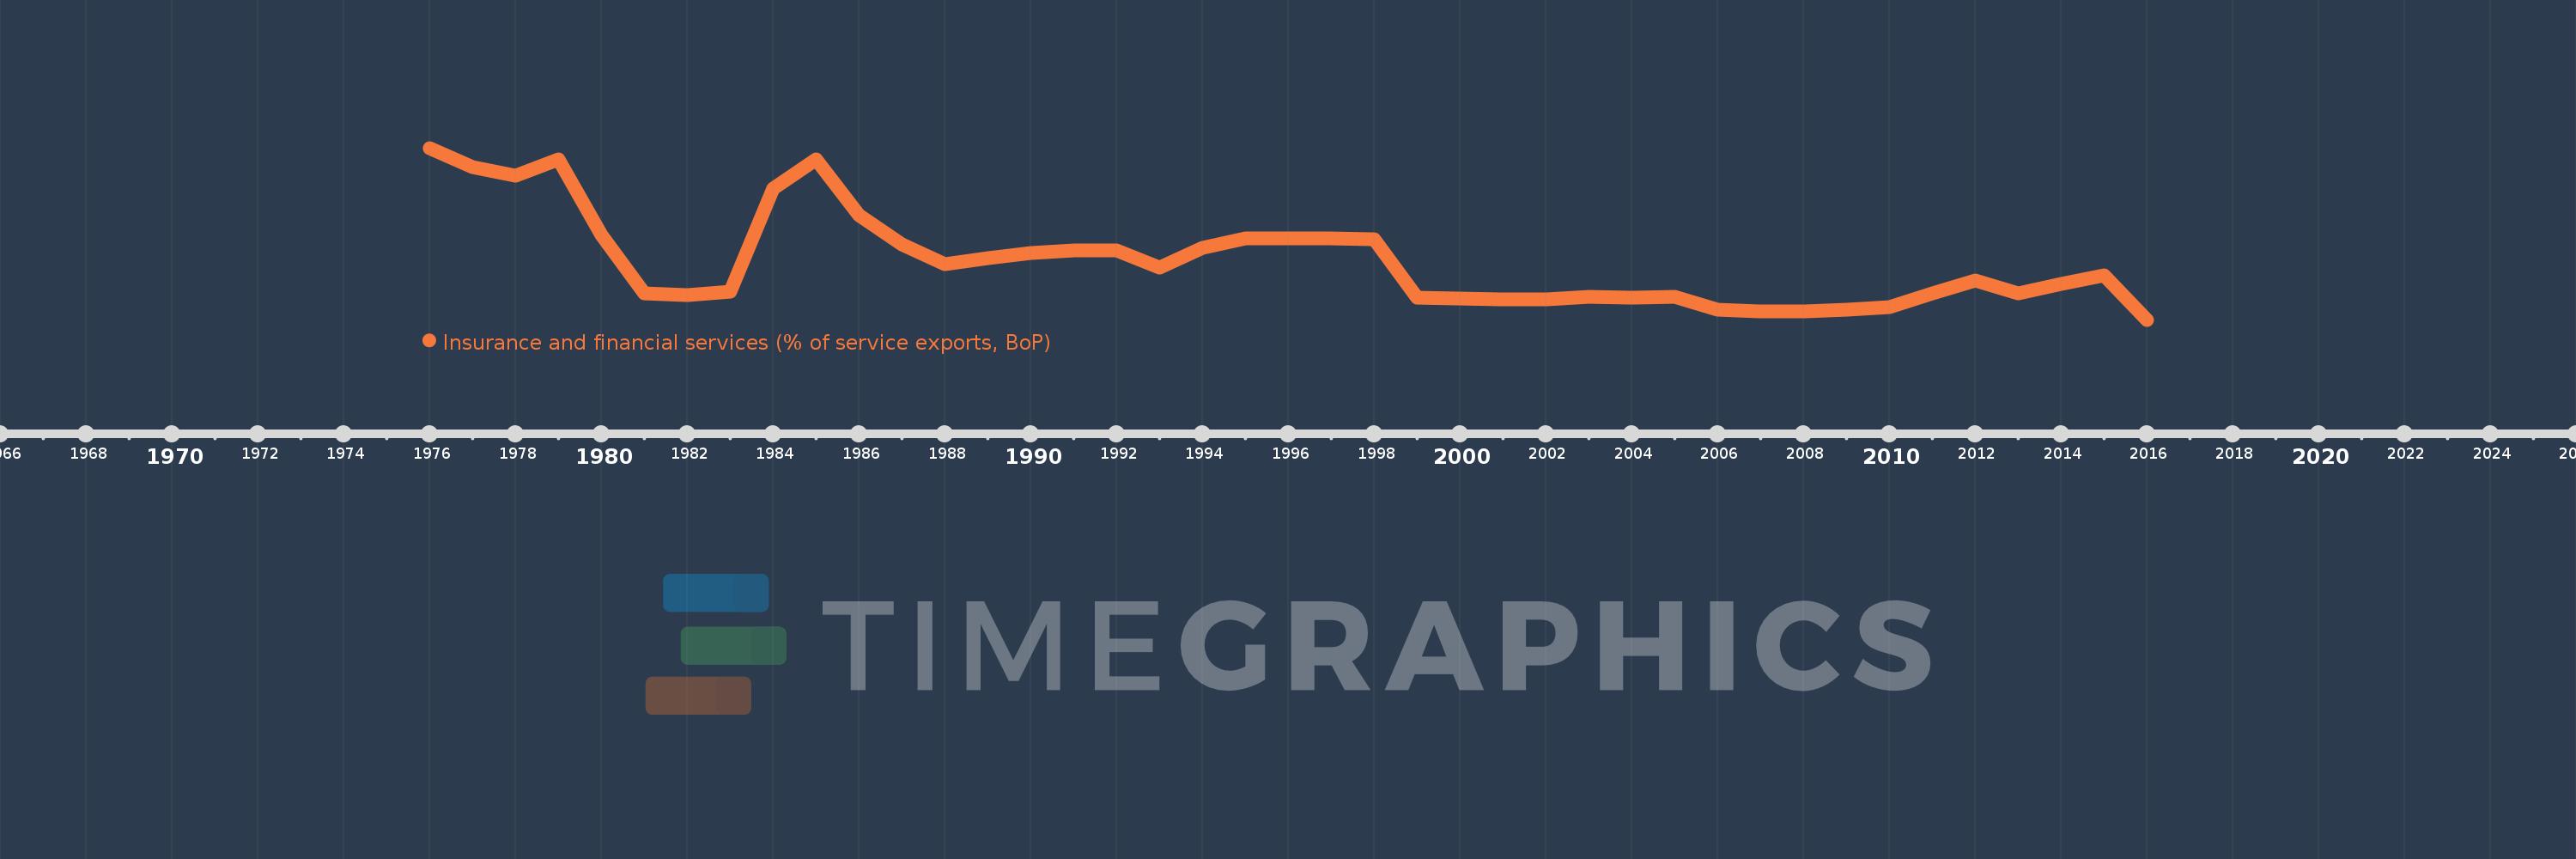
Insurance and financial services (% of service exports, BoP)
2016,2015,2014,2013,2012,2011,2010,2009,2008,2007,2006,2005,2004,2003,2002,2001,2000,1999,1998,1997,1996,1995,1994,1993,1992,1991,1990,1989,1988,1987,1986,1985,1984,1983,1982,1981,1980,1979,1978,1977,1976
This statistics in other country:
AfghanistanAlbaniaAlgeriaAngolaAntigua and BarbudaArab WorldArgentinaArmeniaArubaAustraliaAustriaAzerbaijanBahrainBangladeshBarbadosBelarusBelgiumBelizeBeninBermudaBhutanBoliviaBosnia and HerzegovinaBotswanaBrazilBrunei DarussalamBulgariaBurkina FasoBurundiCabo VerdeCambodiaCameroonCanadaCaribbean small statesCentral African RepublicCentral Europe and the BalticsChadChileChinaColombiaComorosCongo, Dem. Rep.Congo, Rep.Costa RicaCote d'IvoireCroatiaCuracaoCyprusCzech RepublicDenmarkDominicaDominican RepublicEarly-demographic dividendEast Asia & PacificEast Asia & Pacific (excluding high income)East Asia & Pacific (IDA & IBRD countries)EcuadorEgypt, Arab Rep.El SalvadorEritreaEstoniaEthiopiaEuro areaEurope & Central AsiaEurope & Central Asia (excluding high income)Europe & Central Asia (IDA & IBRD countries)European UnionFaroe IslandsFijiFinlandFragile and conflict affected situationsFranceFrench PolynesiaGabonGambia, TheGeorgiaGermanyGhanaGreeceGrenadaGuatemalaGuineaGuinea-BissauGuyanaHaitiHeavily indebted poor countries (HIPC)High incomeHondurasHong Kong SAR, ChinaHungaryIBRD onlyIcelandIDA & IBRD totalIDA onlyIDA totalIndiaIndonesiaIran, Islamic Rep.IraqIrelandIsraelItalyJamaicaJapanJordanKazakhstanKenyaKiribatiKorea, Rep.KosovoKuwaitKyrgyz RepublicLao PDRLate-demographic dividendLatin America & Caribbean Latin America & Caribbean (excluding high income)Latin America & the Caribbean (IDA & IBRD countries)LatviaLeast developed countries: UN classificationLebanonLesothoLiberiaLibyaLithuaniaLow & middle incomeLow incomeLower middle incomeLuxembourgMacao SAR, ChinaMacedonia, FYRMadagascarMalawiMalaysiaMaldivesMaliMaltaMauritaniaMauritiusMexicoMiddle East & North AfricaMiddle East & North Africa (excluding high income)Middle East & North Africa (IDA & IBRD countries)Middle incomeMoldovaMongoliaMontenegroMoroccoMozambiqueMyanmarNamibiaNepalNetherlandsNew CaledoniaNew ZealandNicaraguaNigerNigeriaNorth AmericaNorwayOECD membersOmanOther small statesPacific island small statesPakistanPalauPanamaPapua New GuineaParaguayPeruPhilippinesPolandPortugalPost-demographic dividendPre-demographic dividendQatarRomaniaRussian FederationRwandaSamoaSao Tome and PrincipeSaudi ArabiaSenegalSerbiaSeychellesSierra LeoneSingaporeSint Maarten (Dutch part)Slovak RepublicSloveniaSmall statesSolomon IslandsSouth AfricaSouth AsiaSouth Asia (IDA & IBRD)South SudanSpainSri LankaSt. Kitts and NevisSt. LuciaSt. Vincent and the GrenadinesSub-Saharan Africa Sub-Saharan Africa (excluding high income)Sub-Saharan Africa (IDA & IBRD countries)SudanSurinameSwazilandSwedenSwitzerlandSyrian Arab RepublicTajikistanTanzaniaThailandTimor-LesteTogoTongaTrinidad and TobagoTunisiaTurkeyTuvaluUgandaUkraineUnited KingdomUnited StatesUpper middle incomeUruguayVanuatuVenezuela, RBWest Bank and GazaWorldZambiaZimbabwe Timeline:
This timeline shows a graph from 1976 to 2016 of Ghana. No data until 1975. Number of actual observations by date: 41.
Source name:
World Development Indicators
Source organization:
International Monetary Fund, Balance of Payments Statistics Yearbook and data files.
Categories, topics:
Economy & Growth, Private Sector, Trade
Last updated:
apr 23, 2017
Indicators value changes by year
At the date of observation
Value
Absolute change
Change from previous value
jan 1, 1976
5.353
+5.353
0.0%
jan 1, 1977
4.795
-0.558
-10.42%
jan 1, 1978
4.563
-0.232
-4.85%
jan 1, 1979
5.025
+0.462
10.13%
jan 1, 1980
2.876
-2.148
-42.76%
jan 1, 1981
1.2
-1.677
-58.29%
jan 1, 1982
1.142
-0.058
-4.81%
jan 1, 1983
1.239
+0.097
8.51%
jan 1, 1984
4.188
+2.949
238.03%
jan 1, 1985
5.023
+0.834
19.92%
jan 1, 1986
3.421
-1.602
-31.89%
jan 1, 1987
2.608
-0.813
-23.76%
jan 1, 1988
2.033
-0.575
-22.05%
jan 1, 1989
2.216
+0.183
9.02%
jan 1, 1990
2.349
+0.132
5.96%
jan 1, 1991
2.431
+0.082
3.49%
jan 1, 1992
2.432
+0.001
0.06%
jan 1, 1993
1.943
-0.489
-20.1%
jan 1, 1994
2.488
+0.545
28.04%
jan 1, 1995
2.78
+0.292
11.73%
jan 1, 1996
2.768
-0.011
-0.41%
jan 1, 1997
2.778
+0.01
0.35%
jan 1, 1998
2.755
-0.023
-0.83%
jan 1, 1999
1.078
-1.677
-60.88%
jan 1, 2000
1.06
-0.017
-1.61%
jan 1, 2001
1.019
-0.041
-3.88%
jan 1, 2002
1.022
+0.003
0.27%
jan 1, 2003
1.11
+0.088
8.61%
jan 1, 2004
1.086
-0.024
-2.17%
jan 1, 2005
1.097
+0.011
0.99%
jan 1, 2006
0.73
-0.367
-33.47%
jan 1, 2007
0.69
-0.04
-5.46%
jan 1, 2008
0.687
-0.003
-0.45%
jan 1, 2009
0.744
+0.057
8.34%
jan 1, 2010
0.806
+0.062
8.37%
jan 1, 2011
1.196
+0.39
48.31%
jan 1, 2012
1.563
+0.367
30.68%
jan 1, 2013
1.198
-0.365
-23.35%
jan 1, 2014
1.479
+0.282
23.5%
jan 1, 2015
1.706
+0.227
15.32%
jan 1, 2016
0.445
-1.261
-73.91%
Ranking of countries by current statistics by years


Comments: