29
/
en
AIzaSyAYiBZKx7MnpbEhh9jyipgxe19OcubqV5w
April 1, 2024
226050
Portugal
PRT
true
2
1
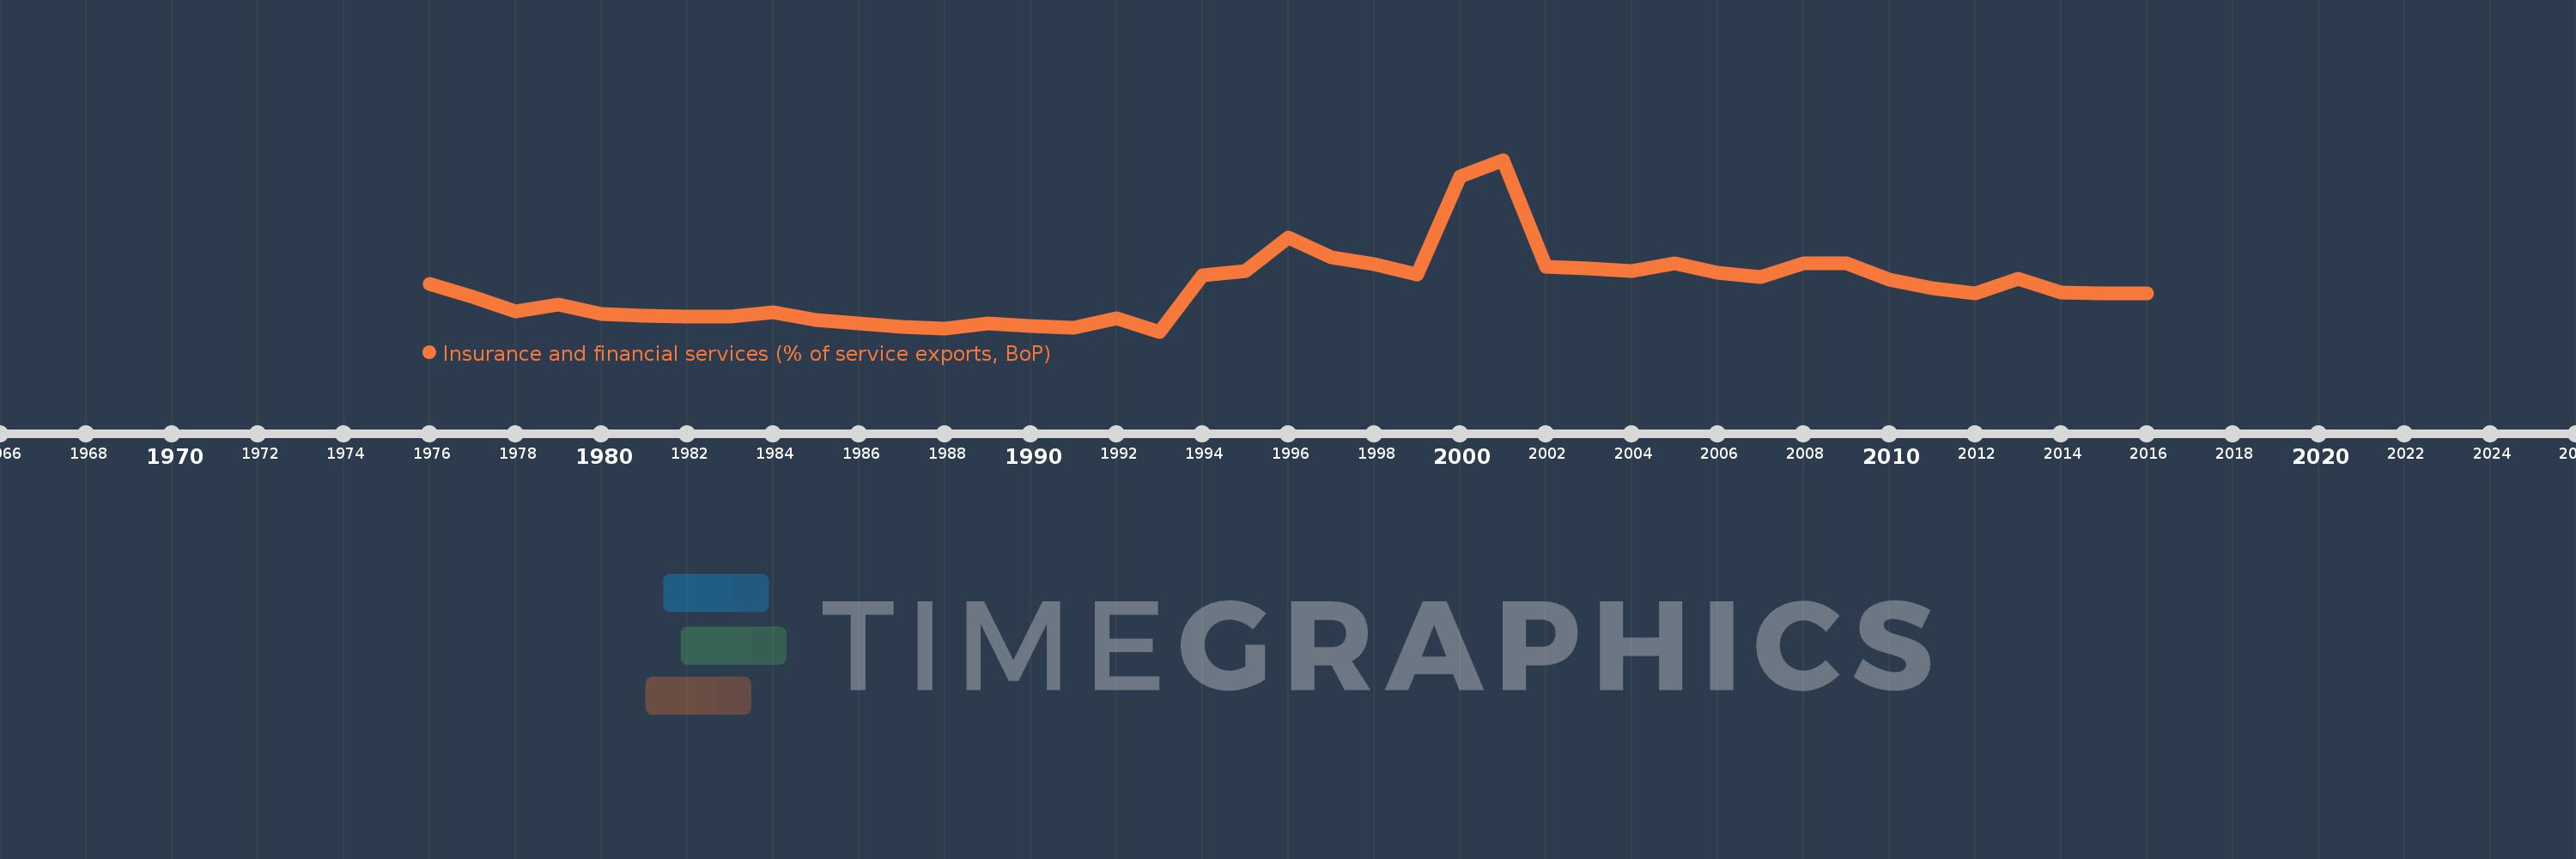
Insurance and financial services (% of service exports, BoP)
2016,2015,2014,2013,2012,2011,2010,2009,2008,2007,2006,2005,2004,2003,2002,2001,2000,1999,1998,1997,1996,1995,1994,1993,1992,1991,1990,1989,1988,1987,1986,1985,1984,1983,1982,1981,1980,1979,1978,1977,1976
This statistics in other country:
AfghanistanAlbaniaAlgeriaAngolaAntigua and BarbudaArab WorldArgentinaArmeniaArubaAustraliaAustriaAzerbaijanBahrainBangladeshBarbadosBelarusBelgiumBelizeBeninBermudaBhutanBoliviaBosnia and HerzegovinaBotswanaBrazilBrunei DarussalamBulgariaBurkina FasoBurundiCabo VerdeCambodiaCameroonCanadaCaribbean small statesCentral African RepublicCentral Europe and the BalticsChadChileChinaColombiaComorosCongo, Dem. Rep.Congo, Rep.Costa RicaCote d'IvoireCroatiaCuracaoCyprusCzech RepublicDenmarkDominicaDominican RepublicEarly-demographic dividendEast Asia & PacificEast Asia & Pacific (excluding high income)East Asia & Pacific (IDA & IBRD countries)EcuadorEgypt, Arab Rep.El SalvadorEritreaEstoniaEthiopiaEuro areaEurope & Central AsiaEurope & Central Asia (excluding high income)Europe & Central Asia (IDA & IBRD countries)European UnionFaroe IslandsFijiFinlandFragile and conflict affected situationsFranceFrench PolynesiaGabonGambia, TheGeorgiaGermanyGhanaGreeceGrenadaGuatemalaGuineaGuinea-BissauGuyanaHaitiHeavily indebted poor countries (HIPC)High incomeHondurasHong Kong SAR, ChinaHungaryIBRD onlyIcelandIDA & IBRD totalIDA onlyIDA totalIndiaIndonesiaIran, Islamic Rep.IraqIrelandIsraelItalyJamaicaJapanJordanKazakhstanKenyaKiribatiKorea, Rep.KosovoKuwaitKyrgyz RepublicLao PDRLate-demographic dividendLatin America & Caribbean Latin America & Caribbean (excluding high income)Latin America & the Caribbean (IDA & IBRD countries)LatviaLeast developed countries: UN classificationLebanonLesothoLiberiaLibyaLithuaniaLow & middle incomeLow incomeLower middle incomeLuxembourgMacao SAR, ChinaMacedonia, FYRMadagascarMalawiMalaysiaMaldivesMaliMaltaMauritaniaMauritiusMexicoMiddle East & North AfricaMiddle East & North Africa (excluding high income)Middle East & North Africa (IDA & IBRD countries)Middle incomeMoldovaMongoliaMontenegroMoroccoMozambiqueMyanmarNamibiaNepalNetherlandsNew CaledoniaNew ZealandNicaraguaNigerNigeriaNorth AmericaNorwayOECD membersOmanOther small statesPacific island small statesPakistanPalauPanamaPapua New GuineaParaguayPeruPhilippinesPolandPortugalPost-demographic dividendPre-demographic dividendQatarRomaniaRussian FederationRwandaSamoaSao Tome and PrincipeSaudi ArabiaSenegalSerbiaSeychellesSierra LeoneSingaporeSint Maarten (Dutch part)Slovak RepublicSloveniaSmall statesSolomon IslandsSouth AfricaSouth AsiaSouth Asia (IDA & IBRD)South SudanSpainSri LankaSt. Kitts and NevisSt. LuciaSt. Vincent and the GrenadinesSub-Saharan Africa Sub-Saharan Africa (excluding high income)Sub-Saharan Africa (IDA & IBRD countries)SudanSurinameSwazilandSwedenSwitzerlandSyrian Arab RepublicTajikistanTanzaniaThailandTimor-LesteTogoTongaTrinidad and TobagoTunisiaTurkeyTuvaluUgandaUkraineUnited KingdomUnited StatesUpper middle incomeUruguayVanuatuVenezuela, RBWest Bank and GazaWorldZambiaZimbabwe Timeline:
This timeline shows a graph from 1976 to 2016 of Portugal. No data until 1975. Number of actual observations by date: 41.
Source name:
World Development Indicators
Source organization:
International Monetary Fund, Balance of Payments Statistics Yearbook and data files.
Categories, topics:
Economy & Growth, Private Sector, Trade
Last updated:
apr 23, 2017
Indicators value changes by year
At the date of observation
Value
Absolute change
Change from previous value
jan 1, 1976
2.498
+2.498
0.0%
jan 1, 1977
1.963
-0.534
-21.39%
jan 1, 1978
1.363
-0.601
-30.6%
jan 1, 1979
1.636
+0.273
20.06%
jan 1, 1980
1.255
-0.381
-23.3%
jan 1, 1981
1.178
-0.077
-6.13%
jan 1, 1982
1.134
-0.044
-3.7%
jan 1, 1983
1.127
-0.007
-0.65%
jan 1, 1984
1.302
+0.175
15.51%
jan 1, 1985
0.992
-0.31
-23.83%
jan 1, 1986
0.856
-0.136
-13.72%
jan 1, 1987
0.718
-0.138
-16.07%
jan 1, 1988
0.65
-0.068
-9.46%
jan 1, 1989
0.843
+0.193
29.69%
jan 1, 1990
0.759
-0.085
-10.03%
jan 1, 1991
0.689
-0.07
-9.2%
jan 1, 1992
1.071
+0.382
55.48%
jan 1, 1993
0.523
-0.548
-51.13%
jan 1, 1994
2.826
+2.302
439.95%
jan 1, 1995
2.993
+0.167
5.92%
jan 1, 1996
4.372
+1.379
46.06%
jan 1, 1997
3.56
-0.812
-18.57%
jan 1, 1998
3.286
-0.273
-7.68%
jan 1, 1999
2.853
-0.433
-13.19%
jan 1, 2000
6.903
+4.05
141.97%
jan 1, 2001
7.577
+0.673
9.75%
jan 1, 2002
3.203
-4.373
-57.72%
jan 1, 2003
3.123
-0.081
-2.52%
jan 1, 2004
3.018
-0.104
-3.34%
jan 1, 2005
3.314
+0.296
9.8%
jan 1, 2006
2.929
-0.385
-11.62%
jan 1, 2007
2.752
-0.177
-6.03%
jan 1, 2008
3.324
+0.572
20.77%
jan 1, 2009
3.321
-0.003
-0.09%
jan 1, 2010
2.642
-0.679
-20.46%
jan 1, 2011
2.303
-0.338
-12.81%
jan 1, 2012
2.106
-0.197
-8.57%
jan 1, 2013
2.694
+0.588
27.93%
jan 1, 2014
2.111
-0.583
-21.65%
jan 1, 2015
2.097
-0.014
-0.65%
jan 1, 2016
2.077
-0.021
-0.98%
Ranking of countries by current statistics by years


Comments: