29
/
en
AIzaSyAYiBZKx7MnpbEhh9jyipgxe19OcubqV5w
April 1, 2024
245752
South Africa
ZAF
true
2
1
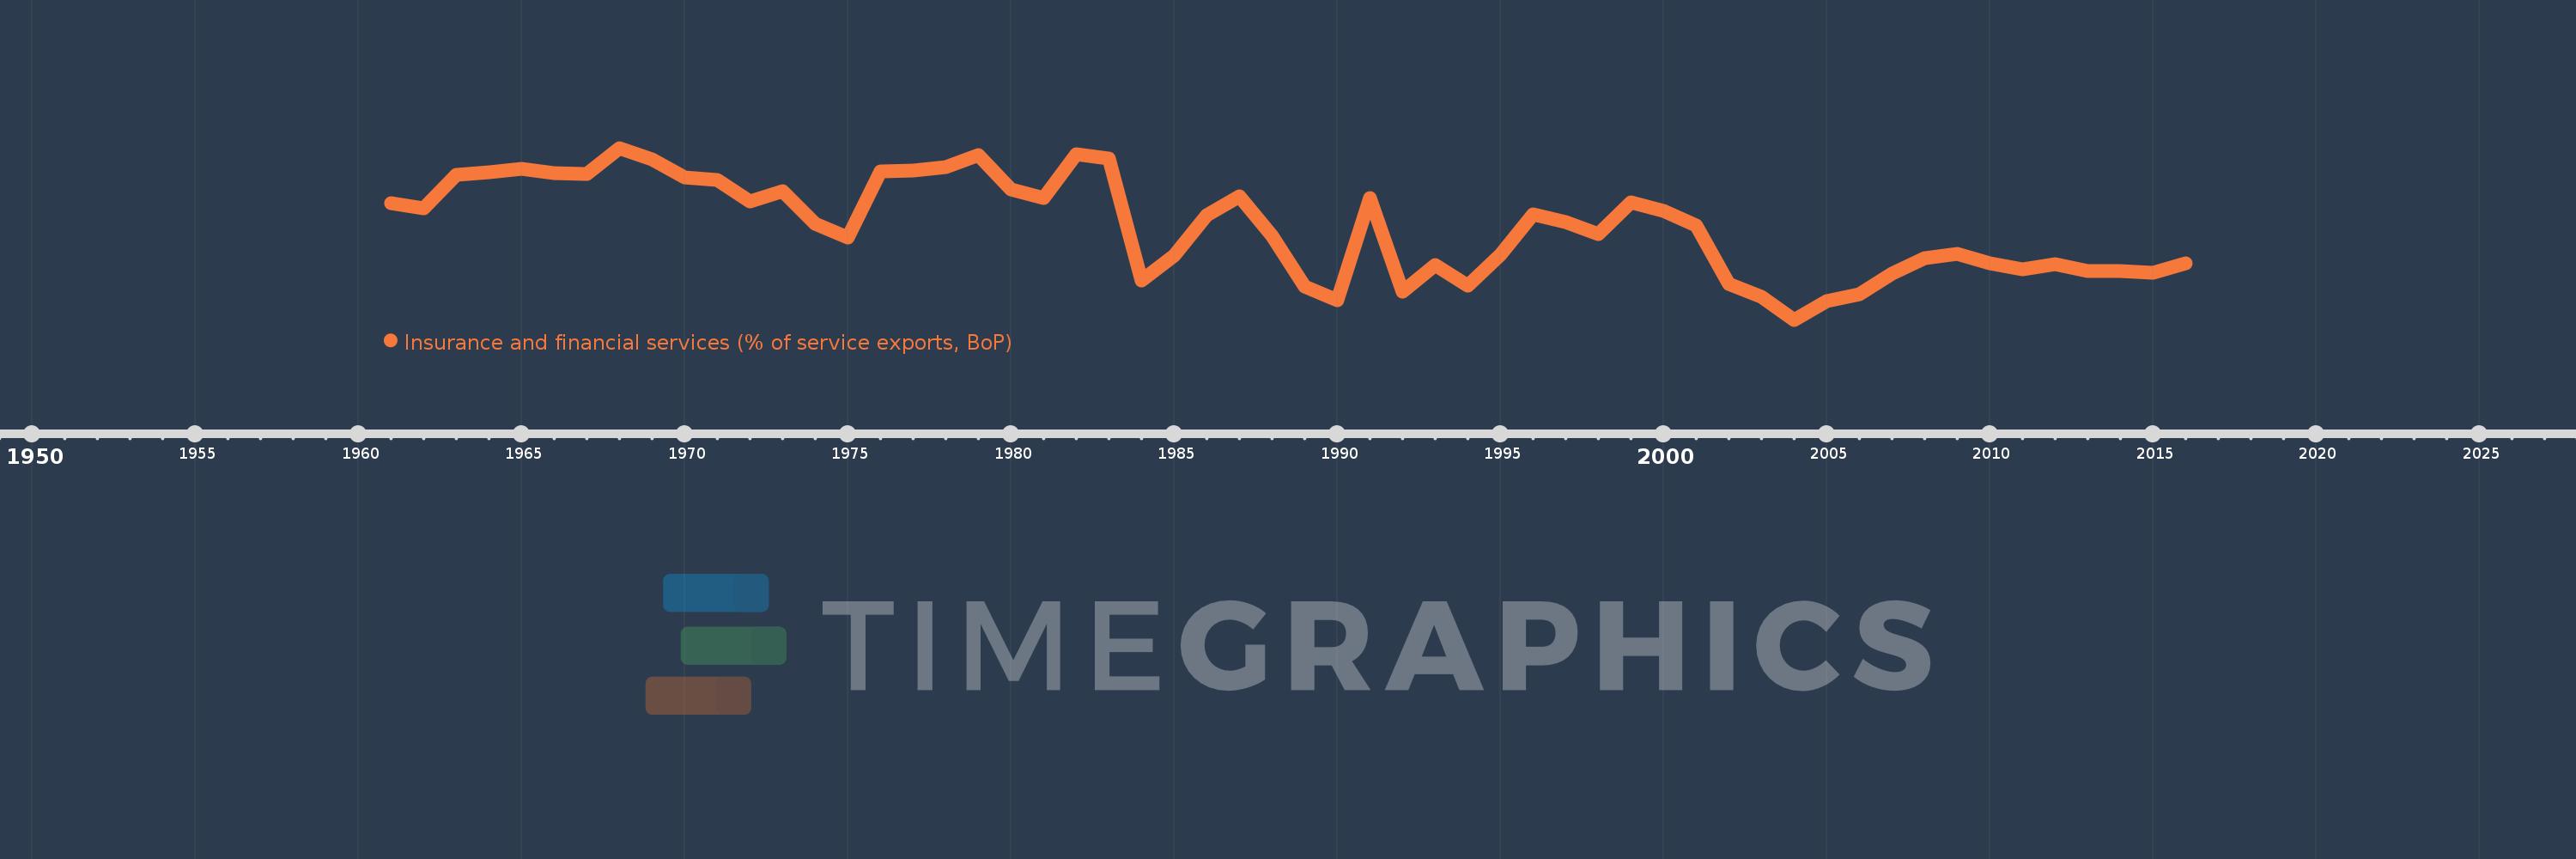
Insurance and financial services (% of service exports, BoP)
2016,2015,2014,2013,2012,2011,2010,2009,2008,2007,2006,2005,2004,2003,2002,2001,2000,1999,1998,1997,1996,1995,1994,1993,1992,1991,1990,1989,1988,1987,1986,1985,1984,1983,1982,1981,1980,1979,1978,1977,1976,1975,1974,1973,1972,1971,1970,1969,1968,1967,1966,1965,1964,1963,1962,1961
This statistics in other country:
AfghanistanAlbaniaAlgeriaAngolaAntigua and BarbudaArab WorldArgentinaArmeniaArubaAustraliaAustriaAzerbaijanBahrainBangladeshBarbadosBelarusBelgiumBelizeBeninBermudaBhutanBoliviaBosnia and HerzegovinaBotswanaBrazilBrunei DarussalamBulgariaBurkina FasoBurundiCabo VerdeCambodiaCameroonCanadaCaribbean small statesCentral African RepublicCentral Europe and the BalticsChadChileChinaColombiaComorosCongo, Dem. Rep.Congo, Rep.Costa RicaCote d'IvoireCroatiaCuracaoCyprusCzech RepublicDenmarkDominicaDominican RepublicEarly-demographic dividendEast Asia & PacificEast Asia & Pacific (excluding high income)East Asia & Pacific (IDA & IBRD countries)EcuadorEgypt, Arab Rep.El SalvadorEritreaEstoniaEthiopiaEuro areaEurope & Central AsiaEurope & Central Asia (excluding high income)Europe & Central Asia (IDA & IBRD countries)European UnionFaroe IslandsFijiFinlandFragile and conflict affected situationsFranceFrench PolynesiaGabonGambia, TheGeorgiaGermanyGhanaGreeceGrenadaGuatemalaGuineaGuinea-BissauGuyanaHaitiHeavily indebted poor countries (HIPC)High incomeHondurasHong Kong SAR, ChinaHungaryIBRD onlyIcelandIDA & IBRD totalIDA onlyIDA totalIndiaIndonesiaIran, Islamic Rep.IraqIrelandIsraelItalyJamaicaJapanJordanKazakhstanKenyaKiribatiKorea, Rep.KosovoKuwaitKyrgyz RepublicLao PDRLate-demographic dividendLatin America & Caribbean Latin America & Caribbean (excluding high income)Latin America & the Caribbean (IDA & IBRD countries)LatviaLeast developed countries: UN classificationLebanonLesothoLiberiaLibyaLithuaniaLow & middle incomeLow incomeLower middle incomeLuxembourgMacao SAR, ChinaMacedonia, FYRMadagascarMalawiMalaysiaMaldivesMaliMaltaMauritaniaMauritiusMexicoMiddle East & North AfricaMiddle East & North Africa (excluding high income)Middle East & North Africa (IDA & IBRD countries)Middle incomeMoldovaMongoliaMontenegroMoroccoMozambiqueMyanmarNamibiaNepalNetherlandsNew CaledoniaNew ZealandNicaraguaNigerNigeriaNorth AmericaNorwayOECD membersOmanOther small statesPacific island small statesPakistanPalauPanamaPapua New GuineaParaguayPeruPhilippinesPolandPortugalPost-demographic dividendPre-demographic dividendQatarRomaniaRussian FederationRwandaSamoaSao Tome and PrincipeSaudi ArabiaSenegalSerbiaSeychellesSierra LeoneSingaporeSint Maarten (Dutch part)Slovak RepublicSloveniaSmall statesSolomon IslandsSouth AfricaSouth AsiaSouth Asia (IDA & IBRD)South SudanSpainSri LankaSt. Kitts and NevisSt. LuciaSt. Vincent and the GrenadinesSub-Saharan Africa Sub-Saharan Africa (excluding high income)Sub-Saharan Africa (IDA & IBRD countries)SudanSurinameSwazilandSwedenSwitzerlandSyrian Arab RepublicTajikistanTanzaniaThailandTimor-LesteTogoTongaTrinidad and TobagoTunisiaTurkeyTuvaluUgandaUkraineUnited KingdomUnited StatesUpper middle incomeUruguayVanuatuVenezuela, RBWest Bank and GazaWorldZambiaZimbabwe Timeline:
This timeline shows a graph from 1961 to 2016 of South Africa. No data until 1960. Number of actual observations by date: 56.
Source name:
World Development Indicators
Source organization:
International Monetary Fund, Balance of Payments Statistics Yearbook and data files.
Categories, topics:
Economy & Growth, Private Sector, Trade
Last updated:
apr 23, 2017
Indicators value changes by year
Maximum:
12.787
jan 1, 1968
At the date of observation
Value
Absolute change
Change from previous value
jan 1, 1961
10.056
+10.056
0.0%
jan 1, 1962
9.783
-0.273
-2.72%
jan 1, 1963
11.458
+1.676
17.13%
jan 1, 1964
11.574
+0.116
1.01%
jan 1, 1965
11.765
+0.191
1.65%
jan 1, 1966
11.538
-0.226
-1.92%
jan 1, 1967
11.481
-0.057
-0.49%
jan 1, 1968
12.787
+1.305
11.37%
jan 1, 1969
12.239
-0.548
-4.29%
jan 1, 1970
11.326
-0.913
-7.46%
jan 1, 1971
11.19
-0.135
-1.2%
jan 1, 1972
10.141
-1.049
-9.38%
jan 1, 1973
10.658
+0.517
5.1%
jan 1, 1974
9.034
-1.625
-15.24%
jan 1, 1975
8.362
-0.672
-7.44%
jan 1, 1976
11.622
+3.26
38.98%
jan 1, 1977
11.67
+0.048
0.41%
jan 1, 1978
11.831
+0.162
1.39%
jan 1, 1979
12.414
+0.583
4.93%
jan 1, 1980
10.726
-1.688
-13.6%
jan 1, 1981
10.316
-0.41
-3.82%
jan 1, 1982
12.463
+2.147
20.81%
jan 1, 1983
12.247
-0.216
-1.73%
jan 1, 1984
6.226
-6.021
-49.16%
jan 1, 1985
7.449
+1.223
19.64%
jan 1, 1986
9.46
+2.011
27.0%
jan 1, 1987
10.394
+0.933
9.87%
jan 1, 1988
8.459
-1.935
-18.61%
jan 1, 1989
5.928
-2.531
-29.92%
jan 1, 1990
5.258
-0.67
-11.3%
jan 1, 1991
10.329
+5.071
96.44%
jan 1, 1992
5.676
-4.653
-45.05%
jan 1, 1993
7.005
+1.329
23.42%
jan 1, 1994
6.003
-1.002
-14.31%
jan 1, 1995
7.526
+1.523
25.37%
jan 1, 1996
9.504
+1.978
26.28%
jan 1, 1997
9.128
-0.376
-3.96%
jan 1, 1998
8.526
-0.601
-6.59%
jan 1, 1999
10.08
+1.554
18.22%
jan 1, 2000
9.658
-0.422
-4.19%
jan 1, 2001
8.937
-0.721
-7.47%
jan 1, 2002
6.066
-2.87
-32.12%
jan 1, 2003
5.435
-0.631
-10.4%
jan 1, 2004
4.299
-1.137
-20.92%
jan 1, 2005
5.209
+0.911
21.19%
jan 1, 2006
5.568
+0.359
6.89%
jan 1, 2007
6.568
+1.0
17.95%
jan 1, 2008
7.332
+0.764
11.64%
jan 1, 2009
7.541
+0.209
2.86%
jan 1, 2010
7.107
-0.434
-5.76%
jan 1, 2011
6.793
-0.314
-4.42%
jan 1, 2012
7.038
+0.245
3.6%
jan 1, 2013
6.719
-0.319
-4.53%
jan 1, 2014
6.722
+0.003
0.04%
jan 1, 2015
6.625
-0.096
-1.43%
jan 1, 2016
7.067
+0.442
6.67%
Ranking of countries by current statistics by years


Comments: