29
/
en
AIzaSyAYiBZKx7MnpbEhh9jyipgxe19OcubqV5w
April 1, 2024
261063
Tanzania
TZA
true
2
1
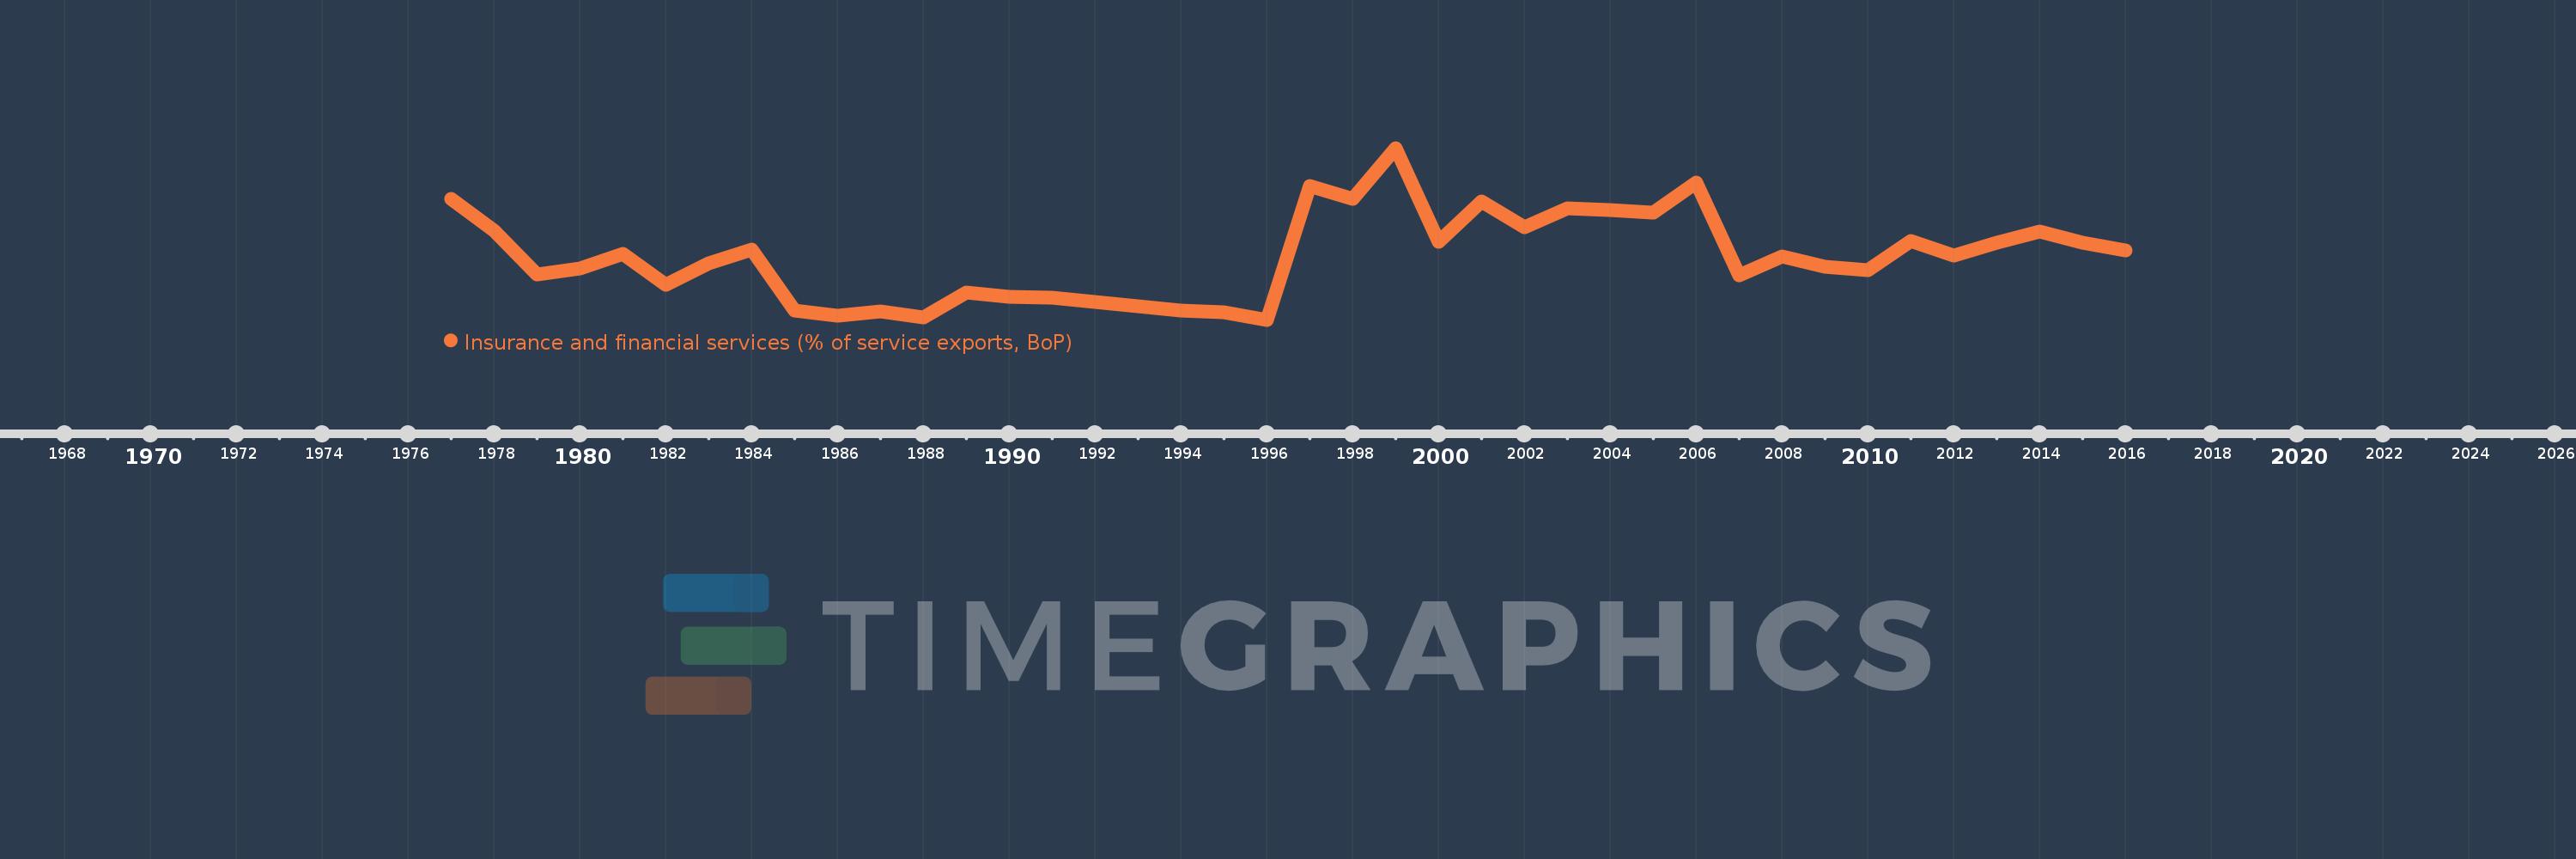
Insurance and financial services (% of service exports, BoP)
2016,2015,2014,2013,2012,2011,2010,2009,2008,2007,2006,2005,2004,2003,2002,2001,2000,1999,1998,1997,1996,1995,1994,1991,1990,1989,1988,1987,1986,1985,1984,1983,1982,1981,1980,1979,1978,1977
This statistics in other country:
AfghanistanAlbaniaAlgeriaAngolaAntigua and BarbudaArab WorldArgentinaArmeniaArubaAustraliaAustriaAzerbaijanBahrainBangladeshBarbadosBelarusBelgiumBelizeBeninBermudaBhutanBoliviaBosnia and HerzegovinaBotswanaBrazilBrunei DarussalamBulgariaBurkina FasoBurundiCabo VerdeCambodiaCameroonCanadaCaribbean small statesCentral African RepublicCentral Europe and the BalticsChadChileChinaColombiaComorosCongo, Dem. Rep.Congo, Rep.Costa RicaCote d'IvoireCroatiaCuracaoCyprusCzech RepublicDenmarkDominicaDominican RepublicEarly-demographic dividendEast Asia & PacificEast Asia & Pacific (excluding high income)East Asia & Pacific (IDA & IBRD countries)EcuadorEgypt, Arab Rep.El SalvadorEritreaEstoniaEthiopiaEuro areaEurope & Central AsiaEurope & Central Asia (excluding high income)Europe & Central Asia (IDA & IBRD countries)European UnionFaroe IslandsFijiFinlandFragile and conflict affected situationsFranceFrench PolynesiaGabonGambia, TheGeorgiaGermanyGhanaGreeceGrenadaGuatemalaGuineaGuinea-BissauGuyanaHaitiHeavily indebted poor countries (HIPC)High incomeHondurasHong Kong SAR, ChinaHungaryIBRD onlyIcelandIDA & IBRD totalIDA onlyIDA totalIndiaIndonesiaIran, Islamic Rep.IraqIrelandIsraelItalyJamaicaJapanJordanKazakhstanKenyaKiribatiKorea, Rep.KosovoKuwaitKyrgyz RepublicLao PDRLate-demographic dividendLatin America & Caribbean Latin America & Caribbean (excluding high income)Latin America & the Caribbean (IDA & IBRD countries)LatviaLeast developed countries: UN classificationLebanonLesothoLiberiaLibyaLithuaniaLow & middle incomeLow incomeLower middle incomeLuxembourgMacao SAR, ChinaMacedonia, FYRMadagascarMalawiMalaysiaMaldivesMaliMaltaMauritaniaMauritiusMexicoMiddle East & North AfricaMiddle East & North Africa (excluding high income)Middle East & North Africa (IDA & IBRD countries)Middle incomeMoldovaMongoliaMontenegroMoroccoMozambiqueMyanmarNamibiaNepalNetherlandsNew CaledoniaNew ZealandNicaraguaNigerNigeriaNorth AmericaNorwayOECD membersOmanOther small statesPacific island small statesPakistanPalauPanamaPapua New GuineaParaguayPeruPhilippinesPolandPortugalPost-demographic dividendPre-demographic dividendQatarRomaniaRussian FederationRwandaSamoaSao Tome and PrincipeSaudi ArabiaSenegalSerbiaSeychellesSierra LeoneSingaporeSint Maarten (Dutch part)Slovak RepublicSloveniaSmall statesSolomon IslandsSouth AfricaSouth AsiaSouth Asia (IDA & IBRD)South SudanSpainSri LankaSt. Kitts and NevisSt. LuciaSt. Vincent and the GrenadinesSub-Saharan Africa Sub-Saharan Africa (excluding high income)Sub-Saharan Africa (IDA & IBRD countries)SudanSurinameSwazilandSwedenSwitzerlandSyrian Arab RepublicTajikistanTanzaniaThailandTimor-LesteTogoTongaTrinidad and TobagoTunisiaTurkeyTuvaluUgandaUkraineUnited KingdomUnited StatesUpper middle incomeUruguayVanuatuVenezuela, RBWest Bank and GazaWorldZambiaZimbabwe Timeline:
This timeline shows a graph from 1977 to 2016 of Tanzania. No data until 1976. Number of actual observations by date: 38.
Source name:
World Development Indicators
Source organization:
International Monetary Fund, Balance of Payments Statistics Yearbook and data files.
Categories, topics:
Economy & Growth, Private Sector, Trade
Last updated:
apr 23, 2017
Indicators value changes by year
At the date of observation
Value
Absolute change
Change from previous value
jan 1, 1977
2.778
+2.778
0.0%
jan 1, 1978
2.034
-0.744
-26.78%
jan 1, 1979
1.046
-0.988
-48.58%
jan 1, 1980
1.174
+0.128
12.25%
jan 1, 1981
1.515
+0.341
29.07%
jan 1, 1982
0.81
-0.705
-46.54%
jan 1, 1983
1.289
+0.479
59.13%
jan 1, 1984
1.603
+0.315
24.41%
jan 1, 1985
0.216
-1.387
-86.51%
jan 1, 1986
0.098
-0.119
-54.9%
jan 1, 1987
0.2
+0.103
105.37%
jan 1, 1988
0.065
-0.135
-67.56%
jan 1, 1989
0.639
+0.574
883.28%
jan 1, 1990
0.523
-0.116
-18.11%
jan 1, 1991
0.522
-0.001
-0.26%
jan 1, 1994
0.216
-0.306
-58.67%
jan 1, 1995
0.187
-0.029
-13.46%
jan 1, 1996
0.009
-0.178
-95.36%
jan 1, 1997
3.072
+3.063
35.37K%
jan 1, 1998
2.773
-0.299
-9.73%
jan 1, 1999
3.932
+1.159
41.82%
jan 1, 2000
1.782
-2.15
-54.67%
jan 1, 2001
2.71
+0.927
52.02%
jan 1, 2002
2.116
-0.594
-21.91%
jan 1, 2003
2.555
+0.439
20.75%
jan 1, 2004
2.522
-0.033
-1.3%
jan 1, 2005
2.464
-0.058
-2.3%
jan 1, 2006
3.145
+0.681
27.64%
jan 1, 2007
1.024
-2.121
-67.45%
jan 1, 2008
1.462
+0.439
42.84%
jan 1, 2009
1.22
-0.242
-16.53%
jan 1, 2010
1.15
-0.07
-5.73%
jan 1, 2011
1.803
+0.652
56.72%
jan 1, 2012
1.469
-0.334
-18.5%
jan 1, 2013
1.772
+0.303
20.62%
jan 1, 2014
2.027
+0.255
14.39%
jan 1, 2015
1.767
-0.26
-12.84%
jan 1, 2016
1.584
-0.183
-10.36%
Ranking of countries by current statistics by years


Comments: