29
/
en
AIzaSyAYiBZKx7MnpbEhh9jyipgxe19OcubqV5w
April 1, 2024
248878
Sri Lanka
LKA
true
2
1
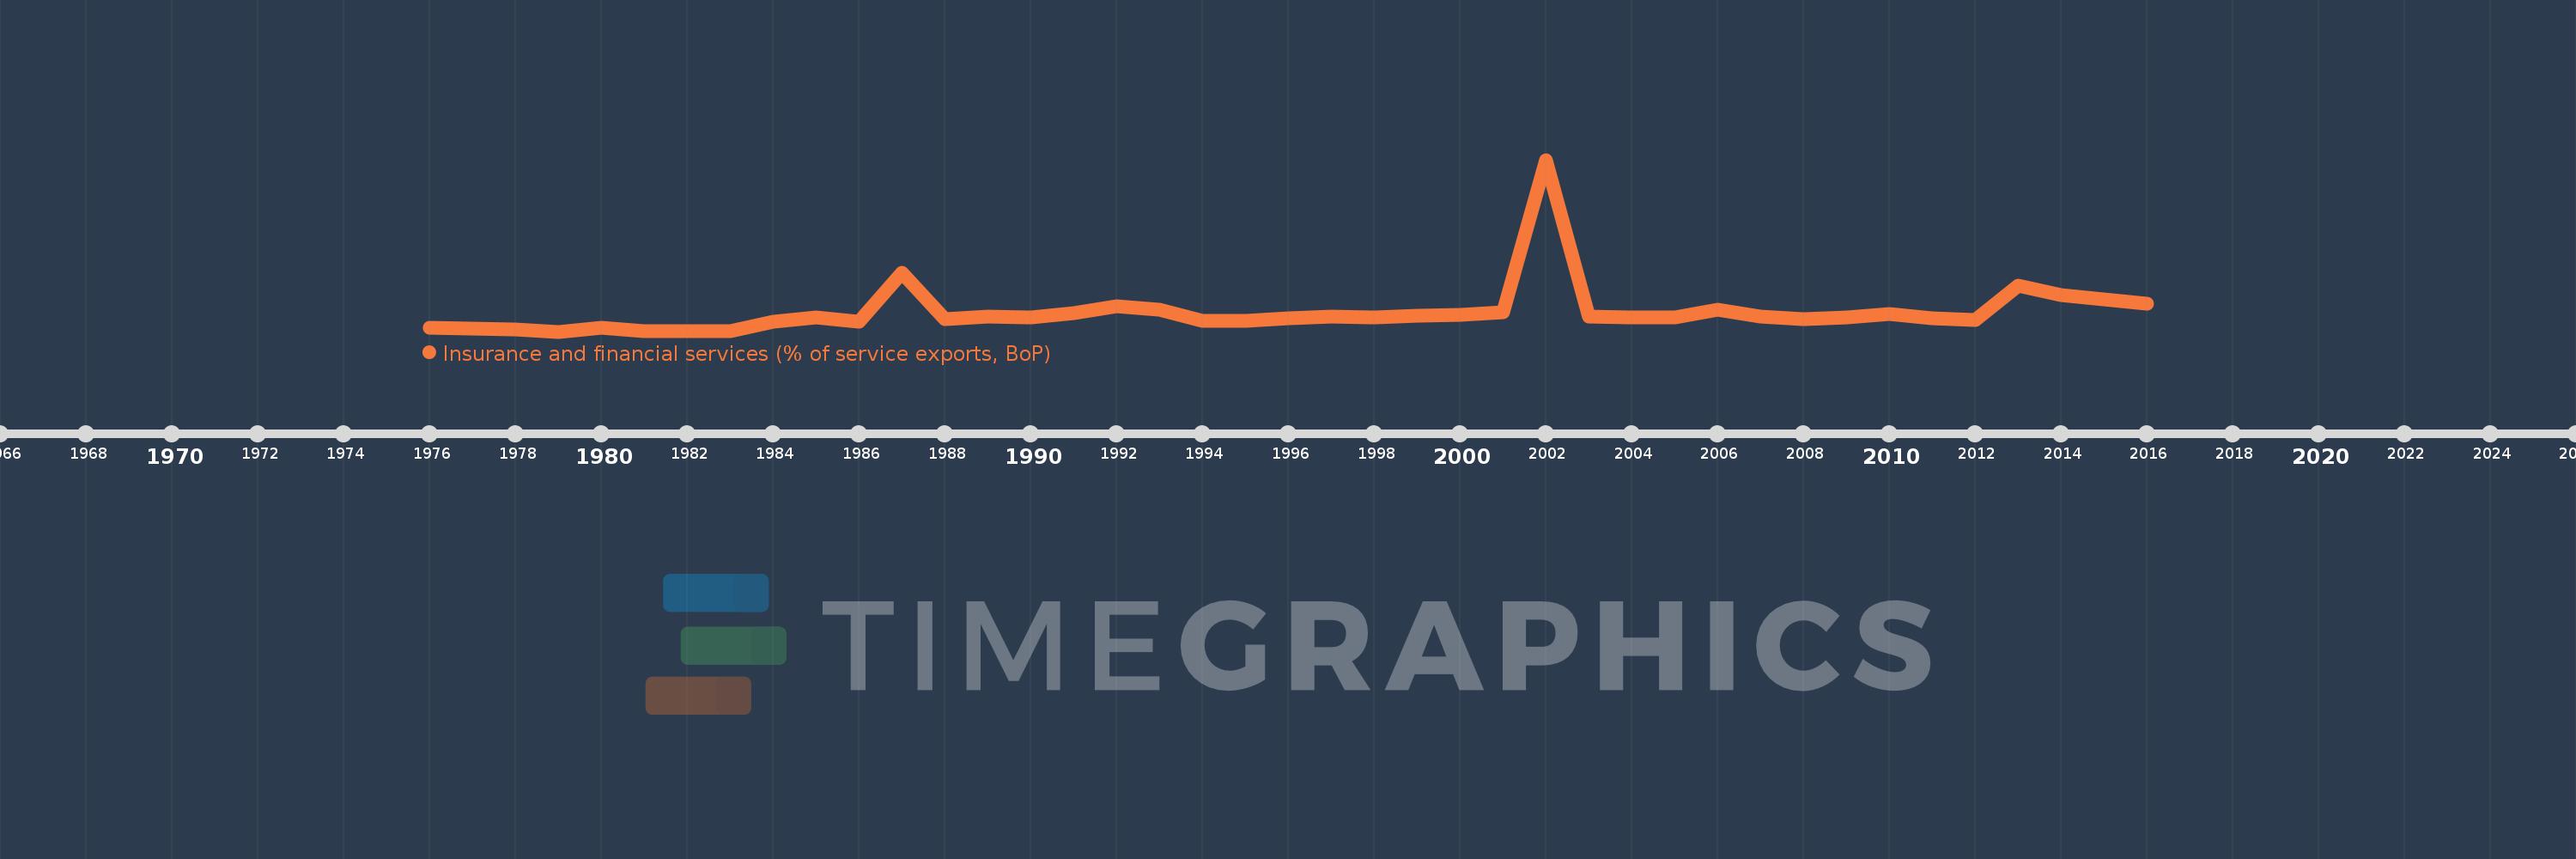
Insurance and financial services (% of service exports, BoP)
2016,2015,2014,2013,2012,2011,2010,2009,2008,2007,2006,2005,2004,2003,2002,2001,2000,1999,1998,1997,1996,1995,1994,1993,1992,1991,1990,1989,1988,1987,1986,1985,1984,1983,1982,1981,1980,1979,1978,1977,1976
This statistics in other country:
AfghanistanAlbaniaAlgeriaAngolaAntigua and BarbudaArab WorldArgentinaArmeniaArubaAustraliaAustriaAzerbaijanBahrainBangladeshBarbadosBelarusBelgiumBelizeBeninBermudaBhutanBoliviaBosnia and HerzegovinaBotswanaBrazilBrunei DarussalamBulgariaBurkina FasoBurundiCabo VerdeCambodiaCameroonCanadaCaribbean small statesCentral African RepublicCentral Europe and the BalticsChadChileChinaColombiaComorosCongo, Dem. Rep.Congo, Rep.Costa RicaCote d'IvoireCroatiaCuracaoCyprusCzech RepublicDenmarkDominicaDominican RepublicEarly-demographic dividendEast Asia & PacificEast Asia & Pacific (excluding high income)East Asia & Pacific (IDA & IBRD countries)EcuadorEgypt, Arab Rep.El SalvadorEritreaEstoniaEthiopiaEuro areaEurope & Central AsiaEurope & Central Asia (excluding high income)Europe & Central Asia (IDA & IBRD countries)European UnionFaroe IslandsFijiFinlandFragile and conflict affected situationsFranceFrench PolynesiaGabonGambia, TheGeorgiaGermanyGhanaGreeceGrenadaGuatemalaGuineaGuinea-BissauGuyanaHaitiHeavily indebted poor countries (HIPC)High incomeHondurasHong Kong SAR, ChinaHungaryIBRD onlyIcelandIDA & IBRD totalIDA onlyIDA totalIndiaIndonesiaIran, Islamic Rep.IraqIrelandIsraelItalyJamaicaJapanJordanKazakhstanKenyaKiribatiKorea, Rep.KosovoKuwaitKyrgyz RepublicLao PDRLate-demographic dividendLatin America & Caribbean Latin America & Caribbean (excluding high income)Latin America & the Caribbean (IDA & IBRD countries)LatviaLeast developed countries: UN classificationLebanonLesothoLiberiaLibyaLithuaniaLow & middle incomeLow incomeLower middle incomeLuxembourgMacao SAR, ChinaMacedonia, FYRMadagascarMalawiMalaysiaMaldivesMaliMaltaMauritaniaMauritiusMexicoMiddle East & North AfricaMiddle East & North Africa (excluding high income)Middle East & North Africa (IDA & IBRD countries)Middle incomeMoldovaMongoliaMontenegroMoroccoMozambiqueMyanmarNamibiaNepalNetherlandsNew CaledoniaNew ZealandNicaraguaNigerNigeriaNorth AmericaNorwayOECD membersOmanOther small statesPacific island small statesPakistanPalauPanamaPapua New GuineaParaguayPeruPhilippinesPolandPortugalPost-demographic dividendPre-demographic dividendQatarRomaniaRussian FederationRwandaSamoaSao Tome and PrincipeSaudi ArabiaSenegalSerbiaSeychellesSierra LeoneSingaporeSint Maarten (Dutch part)Slovak RepublicSloveniaSmall statesSolomon IslandsSouth AfricaSouth AsiaSouth Asia (IDA & IBRD)South SudanSpainSri LankaSt. Kitts and NevisSt. LuciaSt. Vincent and the GrenadinesSub-Saharan Africa Sub-Saharan Africa (excluding high income)Sub-Saharan Africa (IDA & IBRD countries)SudanSurinameSwazilandSwedenSwitzerlandSyrian Arab RepublicTajikistanTanzaniaThailandTimor-LesteTogoTongaTrinidad and TobagoTunisiaTurkeyTuvaluUgandaUkraineUnited KingdomUnited StatesUpper middle incomeUruguayVanuatuVenezuela, RBWest Bank and GazaWorldZambiaZimbabwe Timeline:
This timeline shows a graph from 1976 to 2016 of Sri Lanka. No data until 1975. Number of actual observations by date: 41.
Source name:
World Development Indicators
Source organization:
International Monetary Fund, Balance of Payments Statistics Yearbook and data files.
Categories, topics:
Economy & Growth, Private Sector, Trade
Last updated:
apr 23, 2017
Indicators value changes by year
Maximum:
31.182
jan 1, 2002
At the date of observation
Value
Absolute change
Change from previous value
jan 1, 1976
1.476
+1.476
0.0%
jan 1, 1977
1.426
-0.049
-3.35%
jan 1, 1978
1.191
-0.235
-16.51%
jan 1, 1979
0.869
-0.322
-27.01%
jan 1, 1980
1.591
+0.722
83.06%
jan 1, 1981
0.953
-0.638
-40.13%
jan 1, 1982
0.955
+0.003
0.28%
jan 1, 1983
0.911
-0.044
-4.63%
jan 1, 1984
2.653
+1.742
191.23%
jan 1, 1985
3.444
+0.791
29.81%
jan 1, 1986
2.663
-0.781
-22.69%
jan 1, 1987
11.246
+8.583
322.34%
jan 1, 1988
3.053
-8.193
-72.86%
jan 1, 1989
3.482
+0.429
14.05%
jan 1, 1990
3.358
-0.123
-3.54%
jan 1, 1991
4.066
+0.707
21.06%
jan 1, 1992
5.381
+1.315
32.35%
jan 1, 1993
4.693
-0.688
-12.79%
jan 1, 1994
2.736
-1.957
-41.7%
jan 1, 1995
2.708
-0.028
-1.01%
jan 1, 1996
3.286
+0.578
21.34%
jan 1, 1997
3.596
+0.31
9.44%
jan 1, 1998
3.4
-0.196
-5.44%
jan 1, 1999
3.7
+0.3
8.82%
jan 1, 2000
3.832
+0.132
3.57%
jan 1, 2001
4.321
+0.489
12.76%
jan 1, 2002
31.182
+26.861
621.6%
jan 1, 2003
3.565
-27.617
-88.57%
jan 1, 2004
3.403
-0.163
-4.57%
jan 1, 2005
3.297
-0.106
-3.11%
jan 1, 2006
4.738
+1.441
43.71%
jan 1, 2007
3.52
-1.218
-25.7%
jan 1, 2008
3.11
-0.41
-11.66%
jan 1, 2009
3.416
+0.306
9.84%
jan 1, 2010
3.942
+0.526
15.4%
jan 1, 2011
3.248
-0.694
-17.6%
jan 1, 2012
2.94
-0.308
-9.49%
jan 1, 2013
8.933
+5.993
203.82%
jan 1, 2014
7.352
-1.581
-17.7%
jan 1, 2015
6.617
-0.735
-10.0%
jan 1, 2016
5.83
-0.787
-11.89%
Ranking of countries by current statistics by years


Comments: