29
/
en
AIzaSyAYiBZKx7MnpbEhh9jyipgxe19OcubqV5w
April 1, 2024
189138
Maldives
MDV
true
2
1
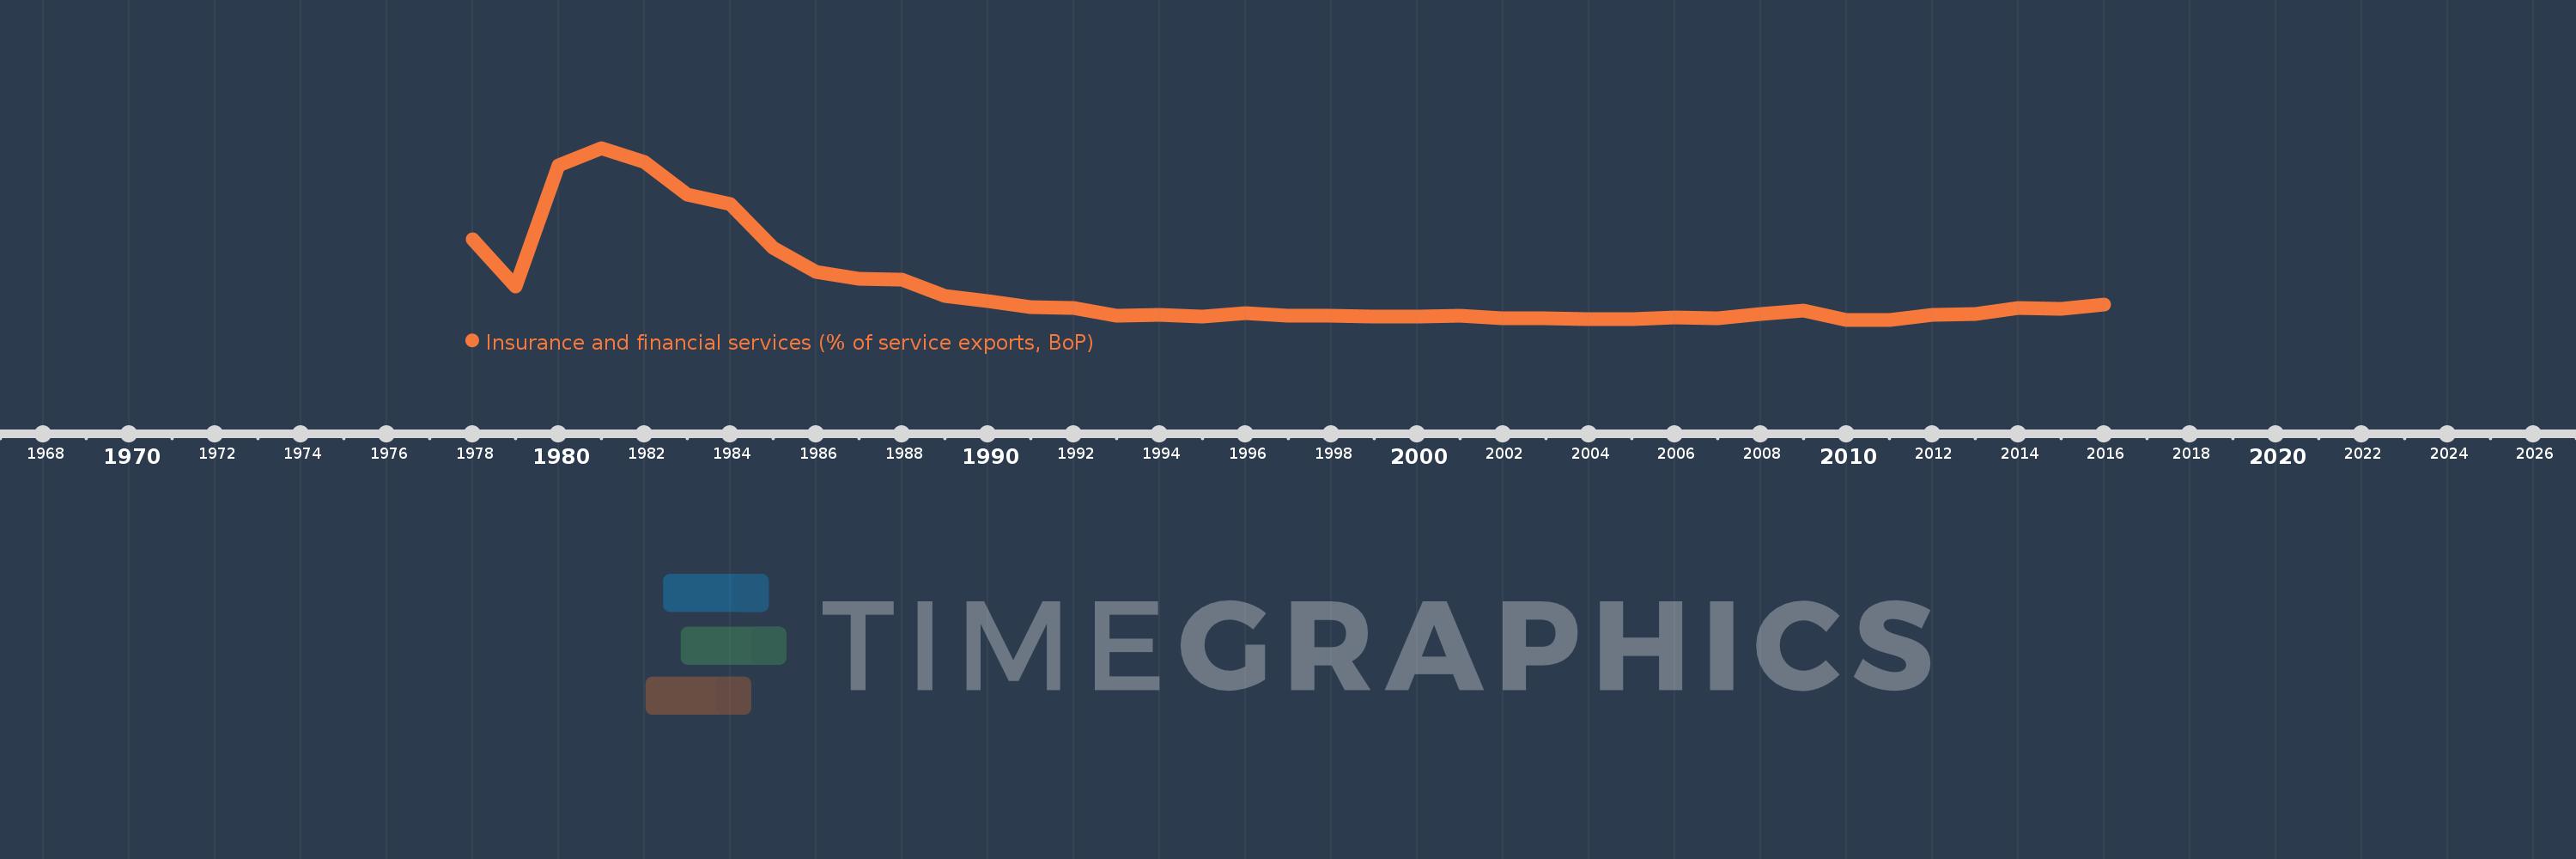
Insurance and financial services (% of service exports, BoP)
2016,2015,2014,2013,2012,2011,2010,2009,2008,2007,2006,2005,2004,2003,2002,2001,2000,1999,1998,1997,1996,1995,1994,1993,1992,1991,1990,1989,1988,1987,1986,1985,1984,1983,1982,1981,1980,1979,1978
This statistics in other country:
AfghanistanAlbaniaAlgeriaAngolaAntigua and BarbudaArab WorldArgentinaArmeniaArubaAustraliaAustriaAzerbaijanBahrainBangladeshBarbadosBelarusBelgiumBelizeBeninBermudaBhutanBoliviaBosnia and HerzegovinaBotswanaBrazilBrunei DarussalamBulgariaBurkina FasoBurundiCabo VerdeCambodiaCameroonCanadaCaribbean small statesCentral African RepublicCentral Europe and the BalticsChadChileChinaColombiaComorosCongo, Dem. Rep.Congo, Rep.Costa RicaCote d'IvoireCroatiaCuracaoCyprusCzech RepublicDenmarkDominicaDominican RepublicEarly-demographic dividendEast Asia & PacificEast Asia & Pacific (excluding high income)East Asia & Pacific (IDA & IBRD countries)EcuadorEgypt, Arab Rep.El SalvadorEritreaEstoniaEthiopiaEuro areaEurope & Central AsiaEurope & Central Asia (excluding high income)Europe & Central Asia (IDA & IBRD countries)European UnionFaroe IslandsFijiFinlandFragile and conflict affected situationsFranceFrench PolynesiaGabonGambia, TheGeorgiaGermanyGhanaGreeceGrenadaGuatemalaGuineaGuinea-BissauGuyanaHaitiHeavily indebted poor countries (HIPC)High incomeHondurasHong Kong SAR, ChinaHungaryIBRD onlyIcelandIDA & IBRD totalIDA onlyIDA totalIndiaIndonesiaIran, Islamic Rep.IraqIrelandIsraelItalyJamaicaJapanJordanKazakhstanKenyaKiribatiKorea, Rep.KosovoKuwaitKyrgyz RepublicLao PDRLate-demographic dividendLatin America & Caribbean Latin America & Caribbean (excluding high income)Latin America & the Caribbean (IDA & IBRD countries)LatviaLeast developed countries: UN classificationLebanonLesothoLiberiaLibyaLithuaniaLow & middle incomeLow incomeLower middle incomeLuxembourgMacao SAR, ChinaMacedonia, FYRMadagascarMalawiMalaysiaMaldivesMaliMaltaMauritaniaMauritiusMexicoMiddle East & North AfricaMiddle East & North Africa (excluding high income)Middle East & North Africa (IDA & IBRD countries)Middle incomeMoldovaMongoliaMontenegroMoroccoMozambiqueMyanmarNamibiaNepalNetherlandsNew CaledoniaNew ZealandNicaraguaNigerNigeriaNorth AmericaNorwayOECD membersOmanOther small statesPacific island small statesPakistanPalauPanamaPapua New GuineaParaguayPeruPhilippinesPolandPortugalPost-demographic dividendPre-demographic dividendQatarRomaniaRussian FederationRwandaSamoaSao Tome and PrincipeSaudi ArabiaSenegalSerbiaSeychellesSierra LeoneSingaporeSint Maarten (Dutch part)Slovak RepublicSloveniaSmall statesSolomon IslandsSouth AfricaSouth AsiaSouth Asia (IDA & IBRD)South SudanSpainSri LankaSt. Kitts and NevisSt. LuciaSt. Vincent and the GrenadinesSub-Saharan Africa Sub-Saharan Africa (excluding high income)Sub-Saharan Africa (IDA & IBRD countries)SudanSurinameSwazilandSwedenSwitzerlandSyrian Arab RepublicTajikistanTanzaniaThailandTimor-LesteTogoTongaTrinidad and TobagoTunisiaTurkeyTuvaluUgandaUkraineUnited KingdomUnited StatesUpper middle incomeUruguayVanuatuVenezuela, RBWest Bank and GazaWorldZambiaZimbabwe Timeline:
This timeline shows a graph from 1978 to 2016 of Maldives. No data until 1977. Number of actual observations by date: 39.
Source name:
World Development Indicators
Source organization:
International Monetary Fund, Balance of Payments Statistics Yearbook and data files.
Categories, topics:
Economy & Growth, Private Sector, Trade
Last updated:
apr 23, 2017
Indicators value changes by year
At the date of observation
Value
Absolute change
Change from previous value
jan 1, 1979
1.607
-2.193
-57.71%
jan 1, 1980
7.267
+5.66
352.16%
jan 1, 1981
8.073
+0.806
11.09%
jan 1, 1982
7.411
-0.662
-8.2%
jan 1, 1983
5.902
-1.508
-20.35%
jan 1, 1984
5.466
-0.436
-7.39%
jan 1, 1985
3.42
-2.046
-37.42%
jan 1, 1986
2.287
-1.134
-33.14%
jan 1, 1987
1.957
-0.329
-14.4%
jan 1, 1988
1.918
-0.039
-1.98%
jan 1, 1989
1.168
-0.75
-39.12%
jan 1, 1990
0.937
-0.231
-19.74%
jan 1, 1991
0.623
-0.314
-33.53%
jan 1, 1992
0.601
-0.022
-3.48%
jan 1, 1993
0.259
-0.342
-56.89%
jan 1, 1994
0.288
+0.029
11.14%
jan 1, 1995
0.188
-0.1
-34.67%
jan 1, 1996
0.346
+0.158
83.76%
jan 1, 1997
0.243
-0.103
-29.72%
jan 1, 1998
0.234
-0.009
-3.68%
jan 1, 1999
0.206
-0.028
-11.97%
jan 1, 2000
0.216
+0.01
4.87%
jan 1, 2001
0.222
+0.005
2.49%
jan 1, 2002
0.113
-0.109
-49.01%
jan 1, 2003
0.11
-0.003
-2.43%
jan 1, 2004
0.093
-0.018
-15.98%
jan 1, 2005
0.079
-0.014
-14.92%
jan 1, 2006
0.172
+0.093
118.26%
jan 1, 2007
0.118
-0.054
-31.51%
jan 1, 2008
0.308
+0.191
161.8%
jan 1, 2009
0.491
+0.182
59.11%
jan 1, 2010
0.052
-0.439
-89.48%
jan 1, 2011
0.054
+0.002
3.8%
jan 1, 2012
0.289
+0.236
440.36%
jan 1, 2013
0.337
+0.047
16.36%
jan 1, 2014
0.586
+0.249
74.02%
jan 1, 2015
0.56
-0.026
-4.42%
jan 1, 2016
0.748
+0.188
33.51%
Ranking of countries by current statistics by years


Comments: