29
/
en
AIzaSyAYiBZKx7MnpbEhh9jyipgxe19OcubqV5w
April 1, 2024
141957
Greece
GRC
true
2
1
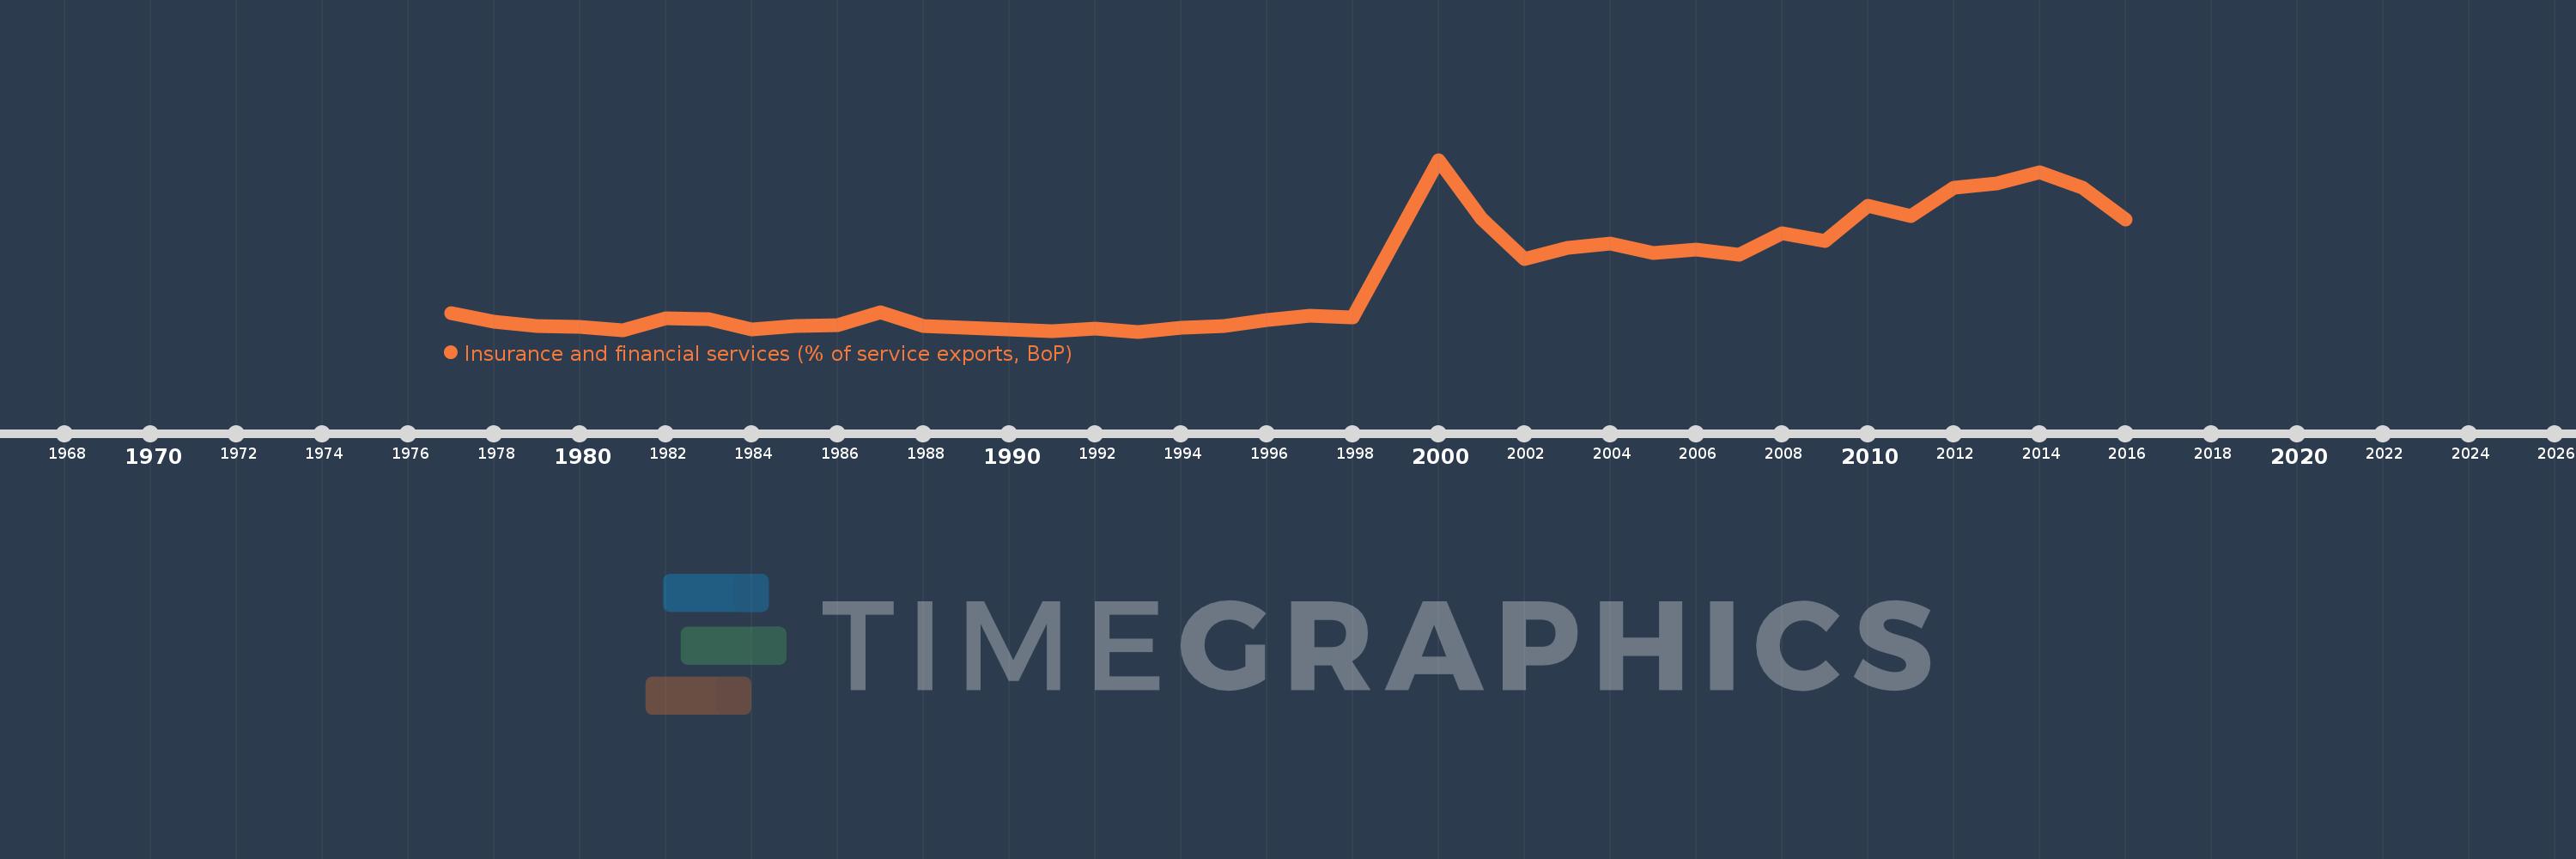
Insurance and financial services (% of service exports, BoP)
2016,2015,2014,2013,2012,2011,2010,2009,2008,2007,2006,2005,2004,2003,2002,2001,2000,1998,1997,1996,1995,1994,1993,1992,1991,1990,1989,1988,1987,1986,1985,1984,1983,1982,1981,1980,1979,1978,1977
This statistics in other country:
AfghanistanAlbaniaAlgeriaAngolaAntigua and BarbudaArab WorldArgentinaArmeniaArubaAustraliaAustriaAzerbaijanBahrainBangladeshBarbadosBelarusBelgiumBelizeBeninBermudaBhutanBoliviaBosnia and HerzegovinaBotswanaBrazilBrunei DarussalamBulgariaBurkina FasoBurundiCabo VerdeCambodiaCameroonCanadaCaribbean small statesCentral African RepublicCentral Europe and the BalticsChadChileChinaColombiaComorosCongo, Dem. Rep.Congo, Rep.Costa RicaCote d'IvoireCroatiaCuracaoCyprusCzech RepublicDenmarkDominicaDominican RepublicEarly-demographic dividendEast Asia & PacificEast Asia & Pacific (excluding high income)East Asia & Pacific (IDA & IBRD countries)EcuadorEgypt, Arab Rep.El SalvadorEritreaEstoniaEthiopiaEuro areaEurope & Central AsiaEurope & Central Asia (excluding high income)Europe & Central Asia (IDA & IBRD countries)European UnionFaroe IslandsFijiFinlandFragile and conflict affected situationsFranceFrench PolynesiaGabonGambia, TheGeorgiaGermanyGhanaGreeceGrenadaGuatemalaGuineaGuinea-BissauGuyanaHaitiHeavily indebted poor countries (HIPC)High incomeHondurasHong Kong SAR, ChinaHungaryIBRD onlyIcelandIDA & IBRD totalIDA onlyIDA totalIndiaIndonesiaIran, Islamic Rep.IraqIrelandIsraelItalyJamaicaJapanJordanKazakhstanKenyaKiribatiKorea, Rep.KosovoKuwaitKyrgyz RepublicLao PDRLate-demographic dividendLatin America & Caribbean Latin America & Caribbean (excluding high income)Latin America & the Caribbean (IDA & IBRD countries)LatviaLeast developed countries: UN classificationLebanonLesothoLiberiaLibyaLithuaniaLow & middle incomeLow incomeLower middle incomeLuxembourgMacao SAR, ChinaMacedonia, FYRMadagascarMalawiMalaysiaMaldivesMaliMaltaMauritaniaMauritiusMexicoMiddle East & North AfricaMiddle East & North Africa (excluding high income)Middle East & North Africa (IDA & IBRD countries)Middle incomeMoldovaMongoliaMontenegroMoroccoMozambiqueMyanmarNamibiaNepalNetherlandsNew CaledoniaNew ZealandNicaraguaNigerNigeriaNorth AmericaNorwayOECD membersOmanOther small statesPacific island small statesPakistanPalauPanamaPapua New GuineaParaguayPeruPhilippinesPolandPortugalPost-demographic dividendPre-demographic dividendQatarRomaniaRussian FederationRwandaSamoaSao Tome and PrincipeSaudi ArabiaSenegalSerbiaSeychellesSierra LeoneSingaporeSint Maarten (Dutch part)Slovak RepublicSloveniaSmall statesSolomon IslandsSouth AfricaSouth AsiaSouth Asia (IDA & IBRD)South SudanSpainSri LankaSt. Kitts and NevisSt. LuciaSt. Vincent and the GrenadinesSub-Saharan Africa Sub-Saharan Africa (excluding high income)Sub-Saharan Africa (IDA & IBRD countries)SudanSurinameSwazilandSwedenSwitzerlandSyrian Arab RepublicTajikistanTanzaniaThailandTimor-LesteTogoTongaTrinidad and TobagoTunisiaTurkeyTuvaluUgandaUkraineUnited KingdomUnited StatesUpper middle incomeUruguayVanuatuVenezuela, RBWest Bank and GazaWorldZambiaZimbabwe Timeline:
This timeline shows a graph from 1977 to 2016 of Greece. No data until 1976. Number of actual observations by date: 39.
Source name:
World Development Indicators
Source organization:
International Monetary Fund, Balance of Payments Statistics Yearbook and data files.
Categories, topics:
Economy & Growth, Private Sector, Trade
Last updated:
apr 23, 2017
Indicators value changes by year
At the date of observation
Value
Absolute change
Change from previous value
jan 1, 1977
0.332
+0.332
0.0%
jan 1, 1978
0.234
-0.097
-29.36%
jan 1, 1979
0.185
-0.05
-21.15%
jan 1, 1980
0.175
-0.01
-5.53%
jan 1, 1981
0.127
-0.048
-27.46%
jan 1, 1982
0.278
+0.152
119.67%
jan 1, 1983
0.268
-0.01
-3.74%
jan 1, 1984
0.14
-0.128
-47.73%
jan 1, 1985
0.184
+0.044
31.1%
jan 1, 1986
0.192
+0.009
4.77%
jan 1, 1987
0.342
+0.15
78.03%
jan 1, 1988
0.185
-0.158
-46.06%
jan 1, 1989
0.157
-0.028
-14.96%
jan 1, 1990
0.145
-0.012
-7.68%
jan 1, 1991
0.122
-0.023
-15.89%
jan 1, 1992
0.152
+0.03
24.89%
jan 1, 1993
0.115
-0.037
-24.51%
jan 1, 1994
0.158
+0.043
37.64%
jan 1, 1995
0.185
+0.026
16.59%
jan 1, 1996
0.25
+0.065
35.41%
jan 1, 1997
0.3
+0.05
19.87%
jan 1, 1998
0.28
-0.02
-6.53%
jan 1, 2000
2.163
+1.883
672.75%
jan 1, 2001
1.457
-0.706
-32.65%
jan 1, 2002
0.977
-0.48
-32.92%
jan 1, 2003
1.113
+0.135
13.82%
jan 1, 2004
1.166
+0.053
4.8%
jan 1, 2005
1.05
-0.116
-9.92%
jan 1, 2006
1.089
+0.038
3.66%
jan 1, 2007
1.034
-0.055
-5.01%
jan 1, 2008
1.285
+0.251
24.29%
jan 1, 2009
1.191
-0.095
-7.39%
jan 1, 2010
1.613
+0.422
35.48%
jan 1, 2011
1.496
-0.117
-7.27%
jan 1, 2012
1.827
+0.331
22.13%
jan 1, 2013
1.883
+0.056
3.07%
jan 1, 2014
2.017
+0.135
7.15%
jan 1, 2015
1.832
-0.186
-9.2%
jan 1, 2016
1.448
-0.384
-20.98%
Ranking of countries by current statistics by years


Comments: