29
/
en
AIzaSyAYiBZKx7MnpbEhh9jyipgxe19OcubqV5w
April 1, 2024
78345
Bangladesh
BGD
true
2
1
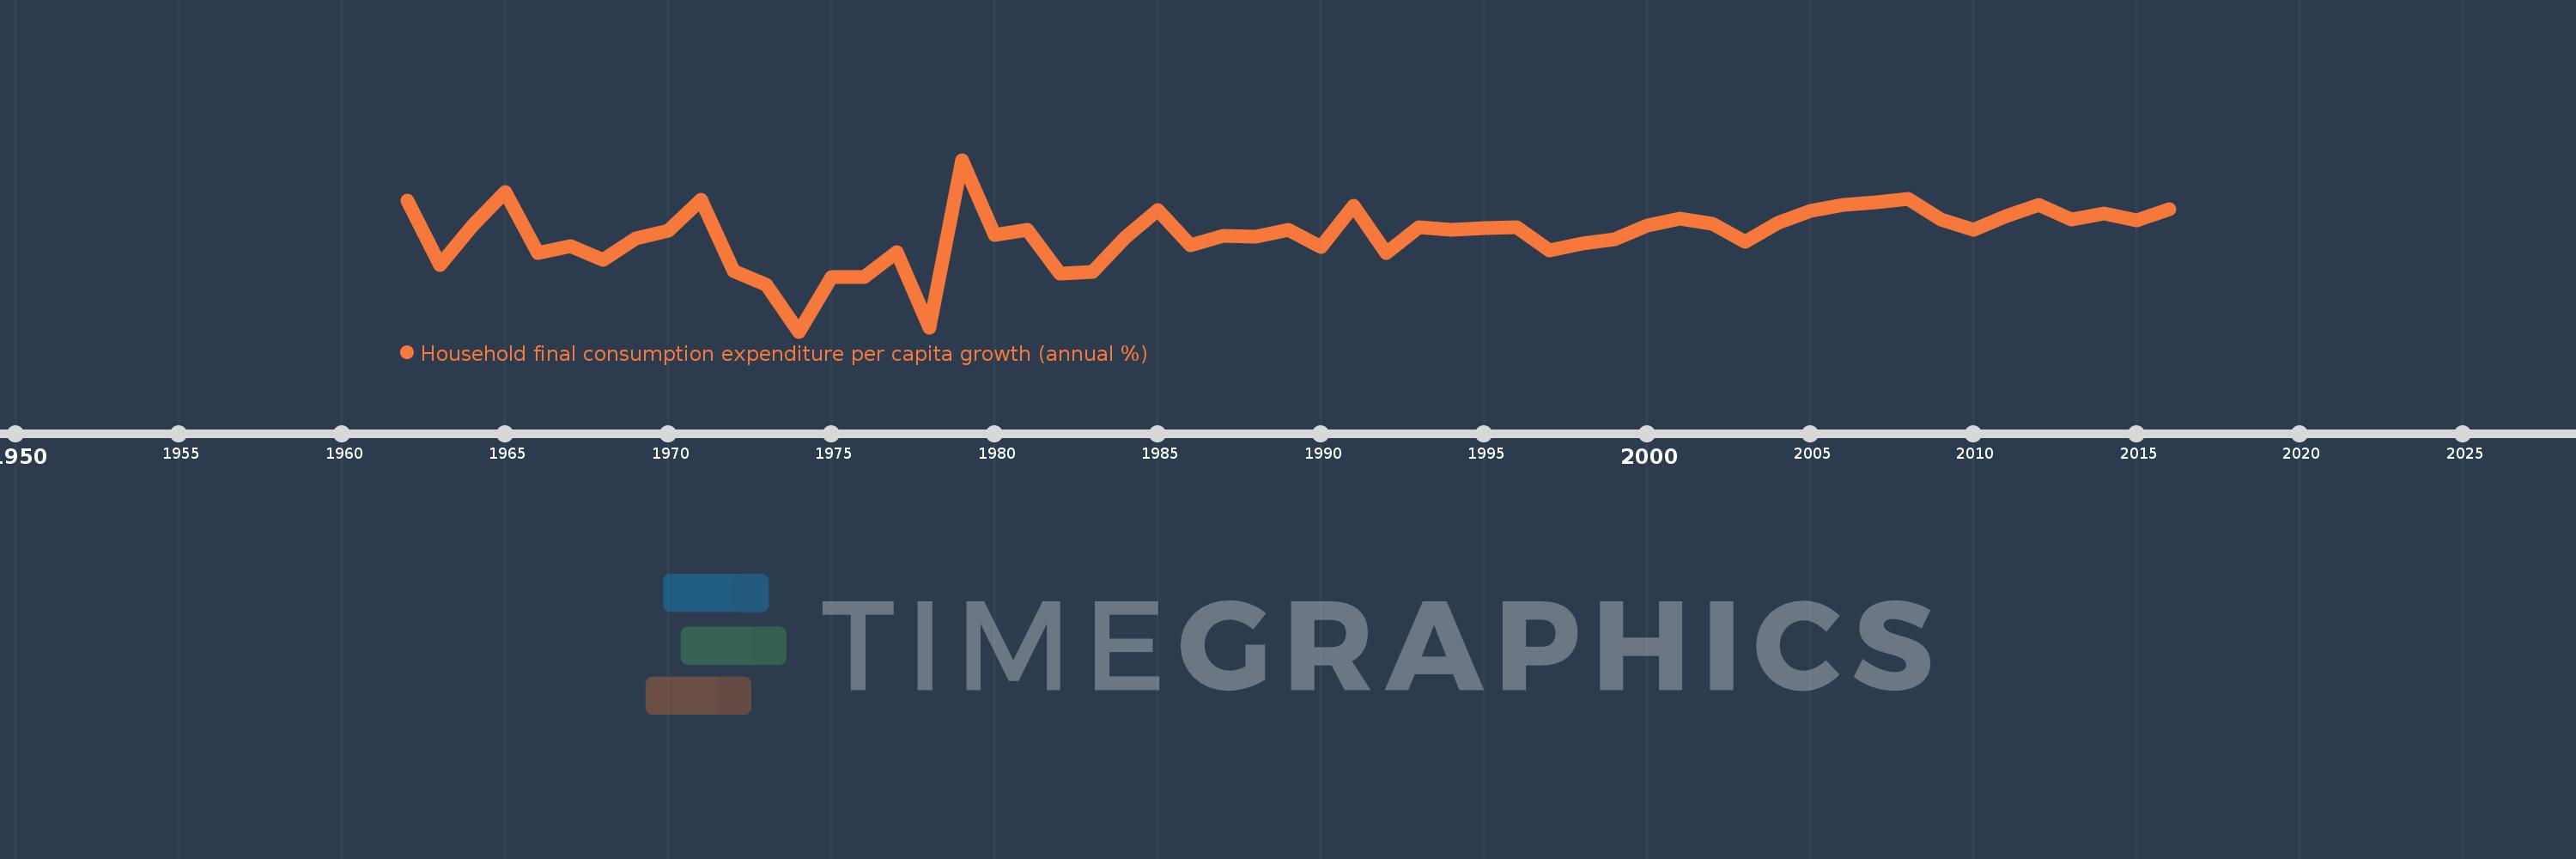
Household final consumption expenditure per capita growth (annual %)
2016,2015,2014,2013,2012,2011,2010,2009,2008,2007,2006,2005,2004,2003,2002,2001,2000,1999,1998,1997,1996,1995,1994,1993,1992,1991,1990,1989,1988,1987,1986,1985,1984,1983,1982,1981,1980,1979,1978,1977,1976,1975,1974,1973,1972,1971,1970,1969,1968,1967,1966,1965,1964,1963,1962
This statistics in other country:
AlbaniaAlgeriaAntigua and BarbudaArab WorldArgentinaArmeniaAustraliaAustriaAzerbaijanBahamas, TheBahrainBangladeshBarbadosBelarusBelgiumBelizeBeninBhutanBoliviaBosnia and HerzegovinaBotswanaBrazilBrunei DarussalamBulgariaBurkina FasoBurundiCabo VerdeCambodiaCameroonCanadaCaribbean small statesCentral Europe and the BalticsChadChileChinaColombiaComorosCongo, Dem. Rep.Congo, Rep.Costa RicaCote d'IvoireCroatiaCubaCyprusCzech RepublicDenmarkDominican RepublicEarly-demographic dividendEast Asia & PacificEast Asia & Pacific (excluding high income)East Asia & Pacific (IDA & IBRD countries)EcuadorEgypt, Arab Rep.El SalvadorEquatorial GuineaEritreaEstoniaEuro areaEurope & Central AsiaEurope & Central Asia (excluding high income)Europe & Central Asia (IDA & IBRD countries)European UnionFinlandFranceGabonGambia, TheGermanyGhanaGreeceGuatemalaGuineaGuinea-BissauHaitiHeavily indebted poor countries (HIPC)High incomeHondurasHong Kong SAR, ChinaHungaryIBRD onlyIcelandIDA & IBRD totalIDA blendIDA onlyIDA totalIndiaIndonesiaIran, Islamic Rep.IrelandIsraelItalyJamaicaJapanJordanKazakhstanKenyaKorea, Rep.KosovoKuwaitKyrgyz RepublicLate-demographic dividendLatin America & Caribbean Latin America & Caribbean (excluding high income)Latin America & the Caribbean (IDA & IBRD countries)LatviaLeast developed countries: UN classificationLebanonLiberiaLithuaniaLow & middle incomeLow incomeLower middle incomeLuxembourgMacao SAR, ChinaMacedonia, FYRMadagascarMalawiMalaysiaMaliMaltaMauritaniaMauritiusMexicoMiddle East & North AfricaMiddle East & North Africa (excluding high income)Middle East & North Africa (IDA & IBRD countries)Middle incomeMoldovaMongoliaMontenegroMoroccoMozambiqueNamibiaNepalNetherlandsNew ZealandNicaraguaNigerNigeriaNorth AmericaNorwayOECD membersOmanOther small statesPakistanPanamaParaguayPeruPhilippinesPolandPortugalPost-demographic dividendPre-demographic dividendPuerto RicoQatarRomaniaRussian FederationRwandaSaudi ArabiaSenegalSerbiaSierra LeoneSingaporeSlovak RepublicSloveniaSmall statesSouth AfricaSouth AsiaSouth Asia (IDA & IBRD)South SudanSpainSri LankaSub-Saharan Africa Sub-Saharan Africa (excluding high income)Sub-Saharan Africa (IDA & IBRD countries)SudanSurinameSwazilandSwedenSwitzerlandTajikistanTanzaniaThailandTimor-LesteTogoTrinidad and TobagoTunisiaTurkeyUgandaUkraineUnited Arab EmiratesUnited KingdomUnited StatesUpper middle incomeUruguayVanuatuVenezuela, RBVietnamWest Bank and GazaWorldZimbabwe Timeline:
This timeline shows a graph from 1962 to 2016 of Bangladesh. No data until 1961. Number of actual observations by date: 55.
Source name:
World Development Indicators
Source organization:
World Bank national accounts data, and OECD National Accounts data files.
Categories, topics:
Economy & Growth
Last updated:
apr 23, 2017
Indicators value changes by year
Minimum:
-15.372
jan 1, 1974
Maximum:
12.538
jan 1, 1979
At the date of observation
Value
Absolute change
Change from previous value
jan 1, 1962
5.889
+5.889
0.0%
jan 1, 1963
-4.511
-10.4
-176.59%
jan 1, 1964
1.912
+6.422
-142.38%
jan 1, 1965
7.331
+5.419
283.5%
jan 1, 1966
-2.588
-9.919
-135.3%
jan 1, 1967
-1.549
+1.039
-40.15%
jan 1, 1968
-3.731
-2.182
140.87%
jan 1, 1969
-0.219
+3.512
-94.14%
jan 1, 1970
1.03
+1.248
-570.77%
jan 1, 1971
6.023
+4.993
484.89%
jan 1, 1972
-5.508
-11.53
-191.45%
jan 1, 1973
-7.784
-2.277
41.34%
jan 1, 1974
-15.372
-7.588
97.47%
jan 1, 1975
-6.443
+8.929
-58.08%
jan 1, 1976
-6.495
-0.051
0.8%
jan 1, 1977
-2.464
+4.031
-62.06%
jan 1, 1978
-14.744
-12.28
498.38%
jan 1, 1979
12.538
+27.282
-185.04%
jan 1, 1980
0.264
-12.274
-97.9%
jan 1, 1981
1.214
+0.95
360.53%
jan 1, 1982
-5.979
-7.193
-592.51%
jan 1, 1983
-5.728
+0.251
-4.2%
jan 1, 1984
-0.071
+5.657
-98.76%
jan 1, 1985
4.387
+4.458
-6.26K%
jan 1, 1986
-1.355
-5.741
-130.89%
jan 1, 1987
0.128
+1.483
-109.46%
jan 1, 1988
0.017
-0.111
-86.63%
jan 1, 1989
1.169
+1.152
6.72K%
jan 1, 1990
-1.655
-2.823
-241.58%
jan 1, 1991
5.016
+6.671
-403.12%
jan 1, 1992
-2.638
-7.654
-152.59%
jan 1, 1993
1.625
+4.263
-161.61%
jan 1, 1994
1.167
-0.458
-28.17%
jan 1, 1995
1.452
+0.285
24.4%
jan 1, 1996
1.544
+0.092
6.31%
jan 1, 1997
-2.21
-3.754
-243.13%
jan 1, 1998
-1.065
+1.144
-51.79%
jan 1, 1999
-0.403
+0.663
-62.2%
jan 1, 2000
1.91
+2.312
-574.25%
jan 1, 2001
2.949
+1.039
54.41%
jan 1, 2002
2.19
-0.758
-25.72%
jan 1, 2003
-0.762
-2.952
-134.79%
jan 1, 2004
2.271
+3.033
-398.04%
jan 1, 2005
4.281
+2.01
88.51%
jan 1, 2006
5.174
+0.893
20.85%
jan 1, 2007
5.637
+0.463
8.94%
jan 1, 2008
6.149
+0.512
9.09%
jan 1, 2009
2.816
-3.333
-54.2%
jan 1, 2010
1.164
-1.653
-58.68%
jan 1, 2011
3.424
+2.26
194.24%
jan 1, 2012
5.25
+1.826
53.34%
jan 1, 2013
2.872
-2.377
-45.29%
jan 1, 2014
3.856
+0.984
34.25%
jan 1, 2015
2.75
-1.106
-28.69%
jan 1, 2016
4.556
+1.806
65.68%
Ranking of countries by current statistics by years


Comments: