29
/
en
AIzaSyAYiBZKx7MnpbEhh9jyipgxe19OcubqV5w
April 1, 2024
214408
Norway
NOR
true
2
1
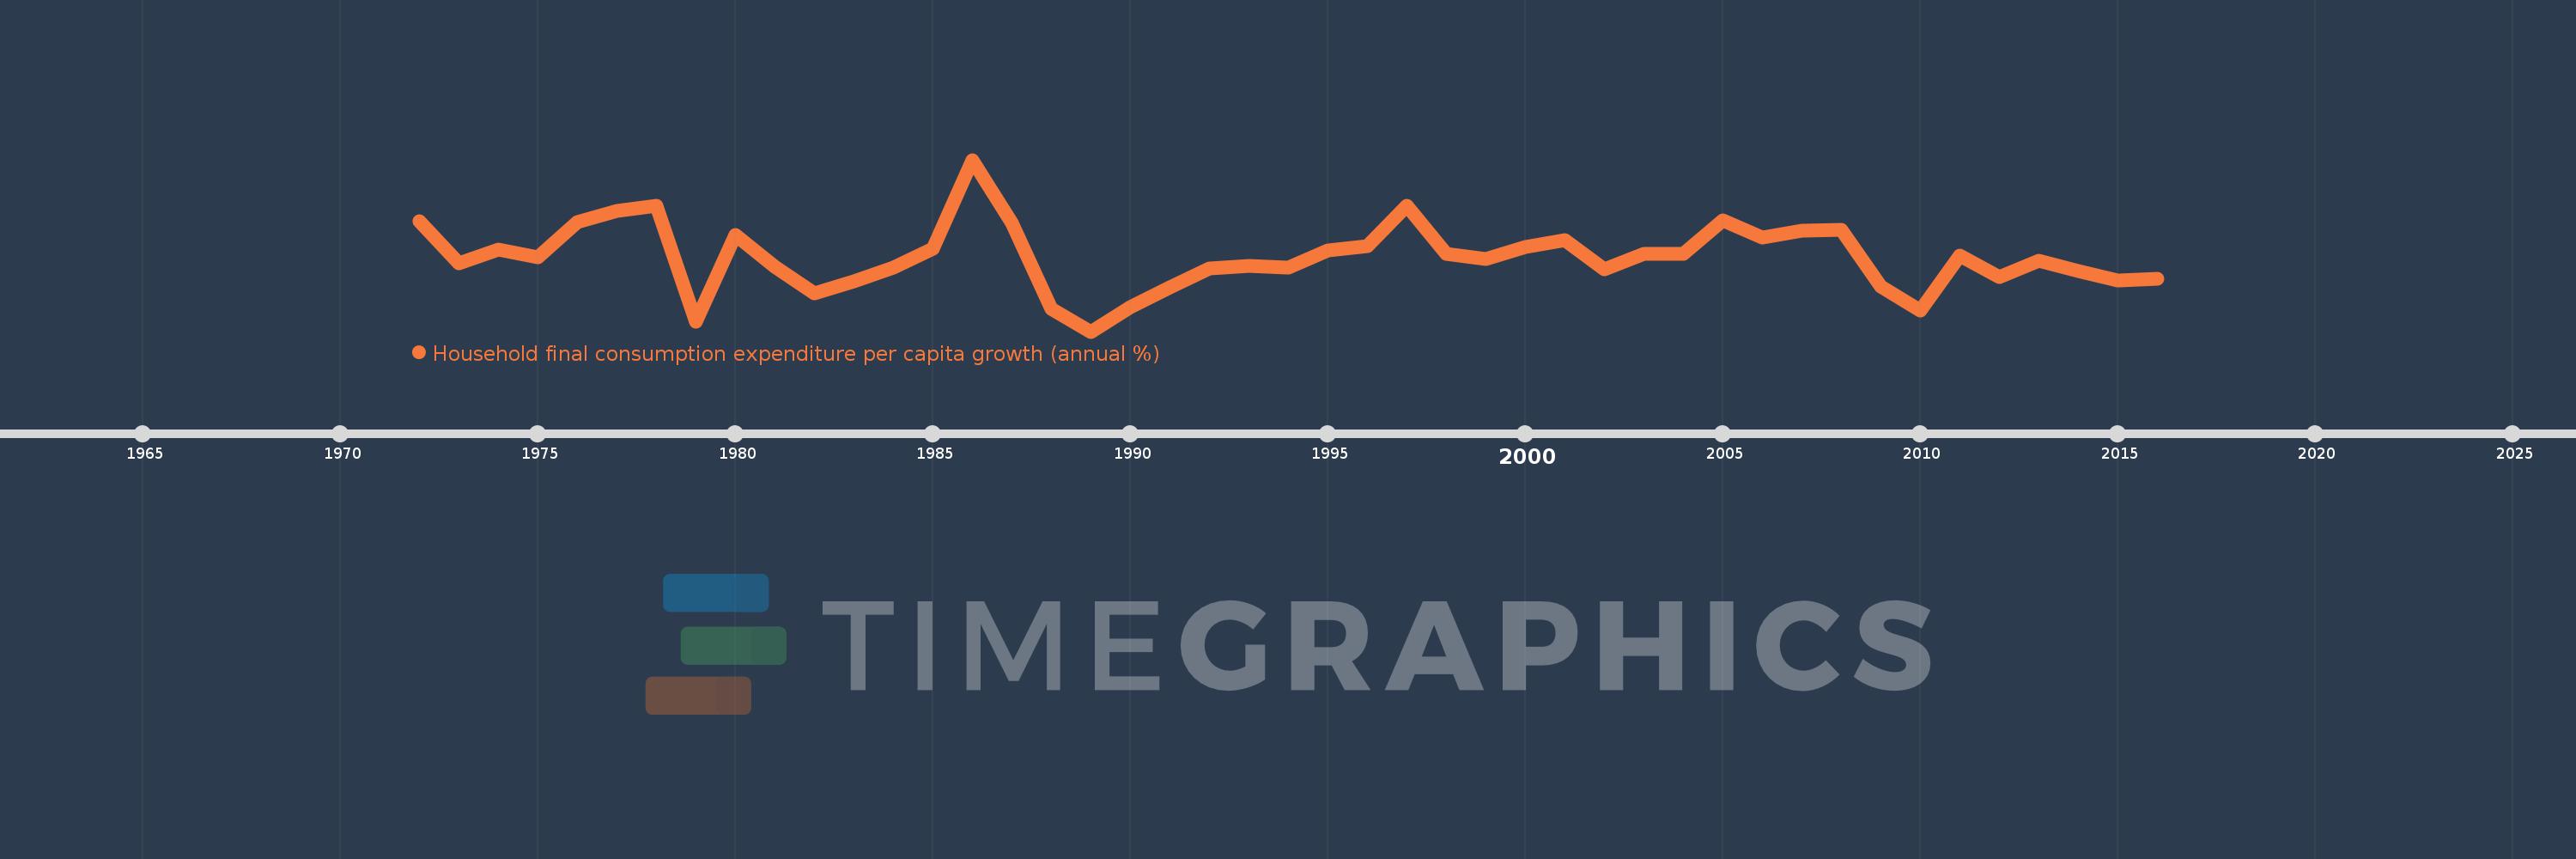
Household final consumption expenditure per capita growth (annual %)
2016,2015,2014,2013,2012,2011,2010,2009,2008,2007,2006,2005,2004,2003,2002,2001,2000,1999,1998,1997,1996,1995,1994,1993,1992,1991,1990,1989,1988,1987,1986,1985,1984,1983,1982,1981,1980,1979,1978,1977,1976,1975,1974,1973,1972
This statistics in other country:
AlbaniaAlgeriaAntigua and BarbudaArab WorldArgentinaArmeniaAustraliaAustriaAzerbaijanBahamas, TheBahrainBangladeshBarbadosBelarusBelgiumBelizeBeninBhutanBoliviaBosnia and HerzegovinaBotswanaBrazilBrunei DarussalamBulgariaBurkina FasoBurundiCabo VerdeCambodiaCameroonCanadaCaribbean small statesCentral Europe and the BalticsChadChileChinaColombiaComorosCongo, Dem. Rep.Congo, Rep.Costa RicaCote d'IvoireCroatiaCubaCyprusCzech RepublicDenmarkDominican RepublicEarly-demographic dividendEast Asia & PacificEast Asia & Pacific (excluding high income)East Asia & Pacific (IDA & IBRD countries)EcuadorEgypt, Arab Rep.El SalvadorEquatorial GuineaEritreaEstoniaEuro areaEurope & Central AsiaEurope & Central Asia (excluding high income)Europe & Central Asia (IDA & IBRD countries)European UnionFinlandFranceGabonGambia, TheGermanyGhanaGreeceGuatemalaGuineaGuinea-BissauHaitiHeavily indebted poor countries (HIPC)High incomeHondurasHong Kong SAR, ChinaHungaryIBRD onlyIcelandIDA & IBRD totalIDA blendIDA onlyIDA totalIndiaIndonesiaIran, Islamic Rep.IrelandIsraelItalyJamaicaJapanJordanKazakhstanKenyaKorea, Rep.KosovoKuwaitKyrgyz RepublicLate-demographic dividendLatin America & Caribbean Latin America & Caribbean (excluding high income)Latin America & the Caribbean (IDA & IBRD countries)LatviaLeast developed countries: UN classificationLebanonLiberiaLithuaniaLow & middle incomeLow incomeLower middle incomeLuxembourgMacao SAR, ChinaMacedonia, FYRMadagascarMalawiMalaysiaMaliMaltaMauritaniaMauritiusMexicoMiddle East & North AfricaMiddle East & North Africa (excluding high income)Middle East & North Africa (IDA & IBRD countries)Middle incomeMoldovaMongoliaMontenegroMoroccoMozambiqueNamibiaNepalNetherlandsNew ZealandNicaraguaNigerNigeriaNorth AmericaNorwayOECD membersOmanOther small statesPakistanPanamaParaguayPeruPhilippinesPolandPortugalPost-demographic dividendPre-demographic dividendPuerto RicoQatarRomaniaRussian FederationRwandaSaudi ArabiaSenegalSerbiaSierra LeoneSingaporeSlovak RepublicSloveniaSmall statesSouth AfricaSouth AsiaSouth Asia (IDA & IBRD)South SudanSpainSri LankaSub-Saharan Africa Sub-Saharan Africa (excluding high income)Sub-Saharan Africa (IDA & IBRD countries)SudanSurinameSwazilandSwedenSwitzerlandTajikistanTanzaniaThailandTimor-LesteTogoTrinidad and TobagoTunisiaTurkeyUgandaUkraineUnited Arab EmiratesUnited KingdomUnited StatesUpper middle incomeUruguayVanuatuVenezuela, RBVietnamWest Bank and GazaWorldZimbabwe Timeline:
This timeline shows a graph from 1972 to 2016 of Norway. No data until 1971. Number of actual observations by date: 45.
Source name:
World Development Indicators
Source organization:
World Bank national accounts data, and OECD National Accounts data files.
Categories, topics:
Economy & Growth
Last updated:
apr 23, 2017
Indicators value changes by year
Minimum:
-2.637
jan 1, 1989
At the date of observation
Value
Absolute change
Change from previous value
jan 1, 1972
4.785
+4.785
0.0%
jan 1, 1973
1.94
-2.845
-59.46%
jan 1, 1974
2.846
+0.906
46.69%
jan 1, 1975
2.339
-0.506
-17.8%
jan 1, 1976
4.711
+2.372
101.43%
jan 1, 1977
5.459
+0.747
15.86%
jan 1, 1978
5.826
+0.367
6.72%
jan 1, 1979
-1.966
-7.791
-133.74%
jan 1, 1980
3.846
+5.812
-295.66%
jan 1, 1981
1.743
-2.103
-54.69%
jan 1, 1982
-0.042
-1.785
-102.43%
jan 1, 1983
0.751
+0.793
-1.87K%
jan 1, 1984
1.643
+0.893
118.91%
jan 1, 1985
2.901
+1.257
76.5%
jan 1, 1986
8.899
+5.998
206.77%
jan 1, 1987
4.675
-4.223
-47.46%
jan 1, 1988
-1.081
-5.757
-123.13%
jan 1, 1989
-2.637
-1.555
143.84%
jan 1, 1990
-1.021
+1.616
-61.3%
jan 1, 1991
0.347
+1.367
-133.96%
jan 1, 1992
1.599
+1.253
361.42%
jan 1, 1993
1.775
+0.176
11.0%
jan 1, 1994
1.664
-0.111
-6.27%
jan 1, 1995
2.808
+1.144
68.75%
jan 1, 1996
3.076
+0.268
9.56%
jan 1, 1997
5.786
+2.71
88.1%
jan 1, 1998
2.563
-3.223
-55.7%
jan 1, 1999
2.218
-0.345
-13.45%
jan 1, 2000
3.026
+0.808
36.42%
jan 1, 2001
3.507
+0.481
15.89%
jan 1, 2002
1.547
-1.96
-55.9%
jan 1, 2003
2.581
+1.035
66.89%
jan 1, 2004
2.588
+0.007
0.26%
jan 1, 2005
4.827
+2.239
86.49%
jan 1, 2006
3.694
-1.133
-23.47%
jan 1, 2007
4.119
+0.425
11.51%
jan 1, 2008
4.224
+0.105
2.56%
jan 1, 2009
0.417
-3.808
-90.14%
jan 1, 2010
-1.225
-1.642
-394.08%
jan 1, 2011
2.477
+3.702
-302.21%
jan 1, 2012
1.03
-1.447
-58.42%
jan 1, 2013
2.123
+1.093
106.09%
jan 1, 2014
1.457
-0.666
-31.36%
jan 1, 2015
0.794
-0.663
-45.48%
jan 1, 2016
0.916
+0.122
15.36%
Ranking of countries by current statistics by years


Comments: