29
/
en
AIzaSyAYiBZKx7MnpbEhh9jyipgxe19OcubqV5w
April 1, 2024
123592
Ecuador
ECU
true
2
1
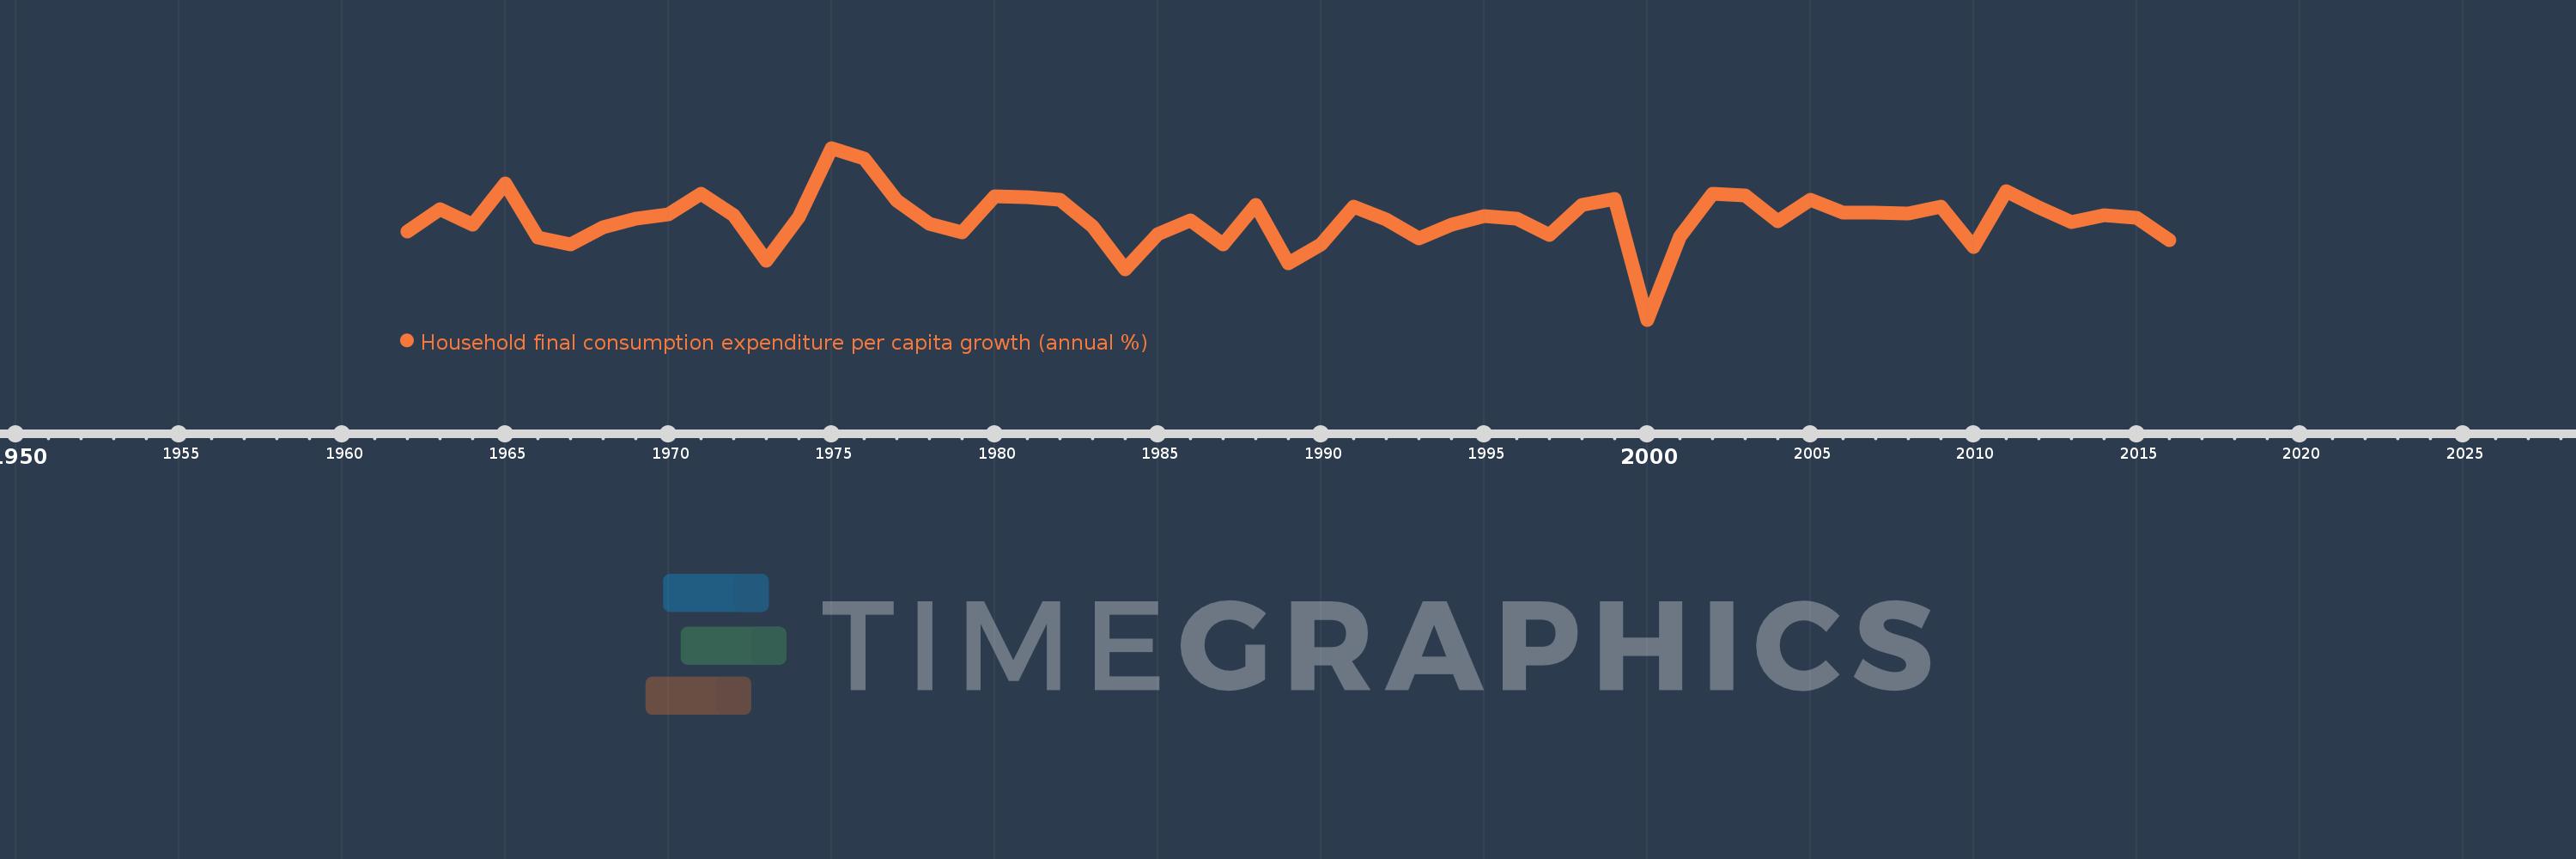
Household final consumption expenditure per capita growth (annual %)
2016,2015,2014,2013,2012,2011,2010,2009,2008,2007,2006,2005,2004,2003,2002,2001,2000,1999,1998,1997,1996,1995,1994,1993,1992,1991,1990,1989,1988,1987,1986,1985,1984,1983,1982,1981,1980,1979,1978,1977,1976,1975,1974,1973,1972,1971,1970,1969,1968,1967,1966,1965,1964,1963,1962
This statistics in other country:
AlbaniaAlgeriaAntigua and BarbudaArab WorldArgentinaArmeniaAustraliaAustriaAzerbaijanBahamas, TheBahrainBangladeshBarbadosBelarusBelgiumBelizeBeninBhutanBoliviaBosnia and HerzegovinaBotswanaBrazilBrunei DarussalamBulgariaBurkina FasoBurundiCabo VerdeCambodiaCameroonCanadaCaribbean small statesCentral Europe and the BalticsChadChileChinaColombiaComorosCongo, Dem. Rep.Congo, Rep.Costa RicaCote d'IvoireCroatiaCubaCyprusCzech RepublicDenmarkDominican RepublicEarly-demographic dividendEast Asia & PacificEast Asia & Pacific (excluding high income)East Asia & Pacific (IDA & IBRD countries)EcuadorEgypt, Arab Rep.El SalvadorEquatorial GuineaEritreaEstoniaEuro areaEurope & Central AsiaEurope & Central Asia (excluding high income)Europe & Central Asia (IDA & IBRD countries)European UnionFinlandFranceGabonGambia, TheGermanyGhanaGreeceGuatemalaGuineaGuinea-BissauHaitiHeavily indebted poor countries (HIPC)High incomeHondurasHong Kong SAR, ChinaHungaryIBRD onlyIcelandIDA & IBRD totalIDA blendIDA onlyIDA totalIndiaIndonesiaIran, Islamic Rep.IrelandIsraelItalyJamaicaJapanJordanKazakhstanKenyaKorea, Rep.KosovoKuwaitKyrgyz RepublicLate-demographic dividendLatin America & Caribbean Latin America & Caribbean (excluding high income)Latin America & the Caribbean (IDA & IBRD countries)LatviaLeast developed countries: UN classificationLebanonLiberiaLithuaniaLow & middle incomeLow incomeLower middle incomeLuxembourgMacao SAR, ChinaMacedonia, FYRMadagascarMalawiMalaysiaMaliMaltaMauritaniaMauritiusMexicoMiddle East & North AfricaMiddle East & North Africa (excluding high income)Middle East & North Africa (IDA & IBRD countries)Middle incomeMoldovaMongoliaMontenegroMoroccoMozambiqueNamibiaNepalNetherlandsNew ZealandNicaraguaNigerNigeriaNorth AmericaNorwayOECD membersOmanOther small statesPakistanPanamaParaguayPeruPhilippinesPolandPortugalPost-demographic dividendPre-demographic dividendPuerto RicoQatarRomaniaRussian FederationRwandaSaudi ArabiaSenegalSerbiaSierra LeoneSingaporeSlovak RepublicSloveniaSmall statesSouth AfricaSouth AsiaSouth Asia (IDA & IBRD)South SudanSpainSri LankaSub-Saharan Africa Sub-Saharan Africa (excluding high income)Sub-Saharan Africa (IDA & IBRD countries)SudanSurinameSwazilandSwedenSwitzerlandTajikistanTanzaniaThailandTimor-LesteTogoTrinidad and TobagoTunisiaTurkeyUgandaUkraineUnited Arab EmiratesUnited KingdomUnited StatesUpper middle incomeUruguayVanuatuVenezuela, RBVietnamWest Bank and GazaWorldZimbabwe Timeline:
This timeline shows a graph from 1962 to 2016 of Ecuador. No data until 1961. Number of actual observations by date: 55.
Source name:
World Development Indicators
Source organization:
World Bank national accounts data, and OECD National Accounts data files.
Categories, topics:
Economy & Growth
Last updated:
apr 23, 2017
Indicators value changes by year
Minimum:
-13.859
jan 1, 2000
Maximum:
12.627
jan 1, 1975
At the date of observation
Value
Absolute change
Change from previous value
jan 1, 1962
-0.266
-0.266
0.0%
jan 1, 1963
3.187
+3.453
-1.3K%
jan 1, 1964
0.812
-2.375
-74.51%
jan 1, 1965
7.13
+6.318
777.64%
jan 1, 1966
-1.178
-8.308
-116.52%
jan 1, 1967
-2.196
-1.017
86.36%
jan 1, 1968
0.349
+2.544
-115.88%
jan 1, 1969
1.746
+1.397
400.75%
jan 1, 1970
2.429
+0.683
39.13%
jan 1, 1971
5.557
+3.128
128.8%
jan 1, 1972
2.223
-3.334
-60.0%
jan 1, 1973
-4.785
-7.008
-315.22%
jan 1, 1974
1.991
+6.776
-141.61%
jan 1, 1975
12.627
+10.636
534.22%
jan 1, 1976
10.999
-1.628
-12.89%
jan 1, 1977
4.452
-6.547
-59.52%
jan 1, 1978
0.977
-3.475
-78.06%
jan 1, 1979
-0.377
-1.354
-138.62%
jan 1, 1980
5.124
+5.501
-1.46K%
jan 1, 1981
5.087
-0.037
-0.72%
jan 1, 1982
4.659
-0.429
-8.43%
jan 1, 1983
0.583
-4.076
-87.5%
jan 1, 1984
-6.111
-6.694
-1.15K%
jan 1, 1985
-0.695
+5.417
-88.63%
jan 1, 1986
1.476
+2.171
-312.51%
jan 1, 1987
-2.208
-3.684
-249.55%
jan 1, 1988
3.787
+5.995
-271.55%
jan 1, 1989
-5.129
-8.917
-235.42%
jan 1, 1990
-2.247
+2.882
-56.19%
jan 1, 1991
3.639
+5.885
-261.94%
jan 1, 1992
1.628
-2.01
-55.26%
jan 1, 1993
-1.278
-2.906
-178.51%
jan 1, 1994
0.853
+2.131
-166.74%
jan 1, 1995
2.189
+1.336
156.66%
jan 1, 1996
1.766
-0.424
-19.35%
jan 1, 1997
-0.841
-2.606
-147.61%
jan 1, 1998
3.813
+4.653
-553.54%
jan 1, 1999
4.785
+0.972
25.49%
jan 1, 2000
-13.859
-18.644
-389.66%
jan 1, 2001
-1.031
+12.828
-92.56%
jan 1, 2002
5.606
+6.637
-643.66%
jan 1, 2003
5.28
-0.326
-5.81%
jan 1, 2004
1.315
-3.964
-75.09%
jan 1, 2005
4.702
+3.387
257.46%
jan 1, 2006
2.713
-1.99
-42.31%
jan 1, 2007
2.617
-0.096
-3.53%
jan 1, 2008
2.491
-0.126
-4.8%
jan 1, 2009
3.636
+1.144
45.94%
jan 1, 2010
-2.632
-6.268
-172.41%
jan 1, 2011
5.957
+8.59
-326.29%
jan 1, 2012
3.448
-2.509
-42.12%
jan 1, 2013
1.257
-2.191
-63.54%
jan 1, 2014
2.311
+1.054
83.83%
jan 1, 2015
1.847
-0.464
-20.1%
jan 1, 2016
-1.638
-3.484
-188.68%
Ranking of countries by current statistics by years


Comments: