29
/
en
AIzaSyAYiBZKx7MnpbEhh9jyipgxe19OcubqV5w
April 1, 2024
41524
Latin America & Caribbean
LCN
false
2
1
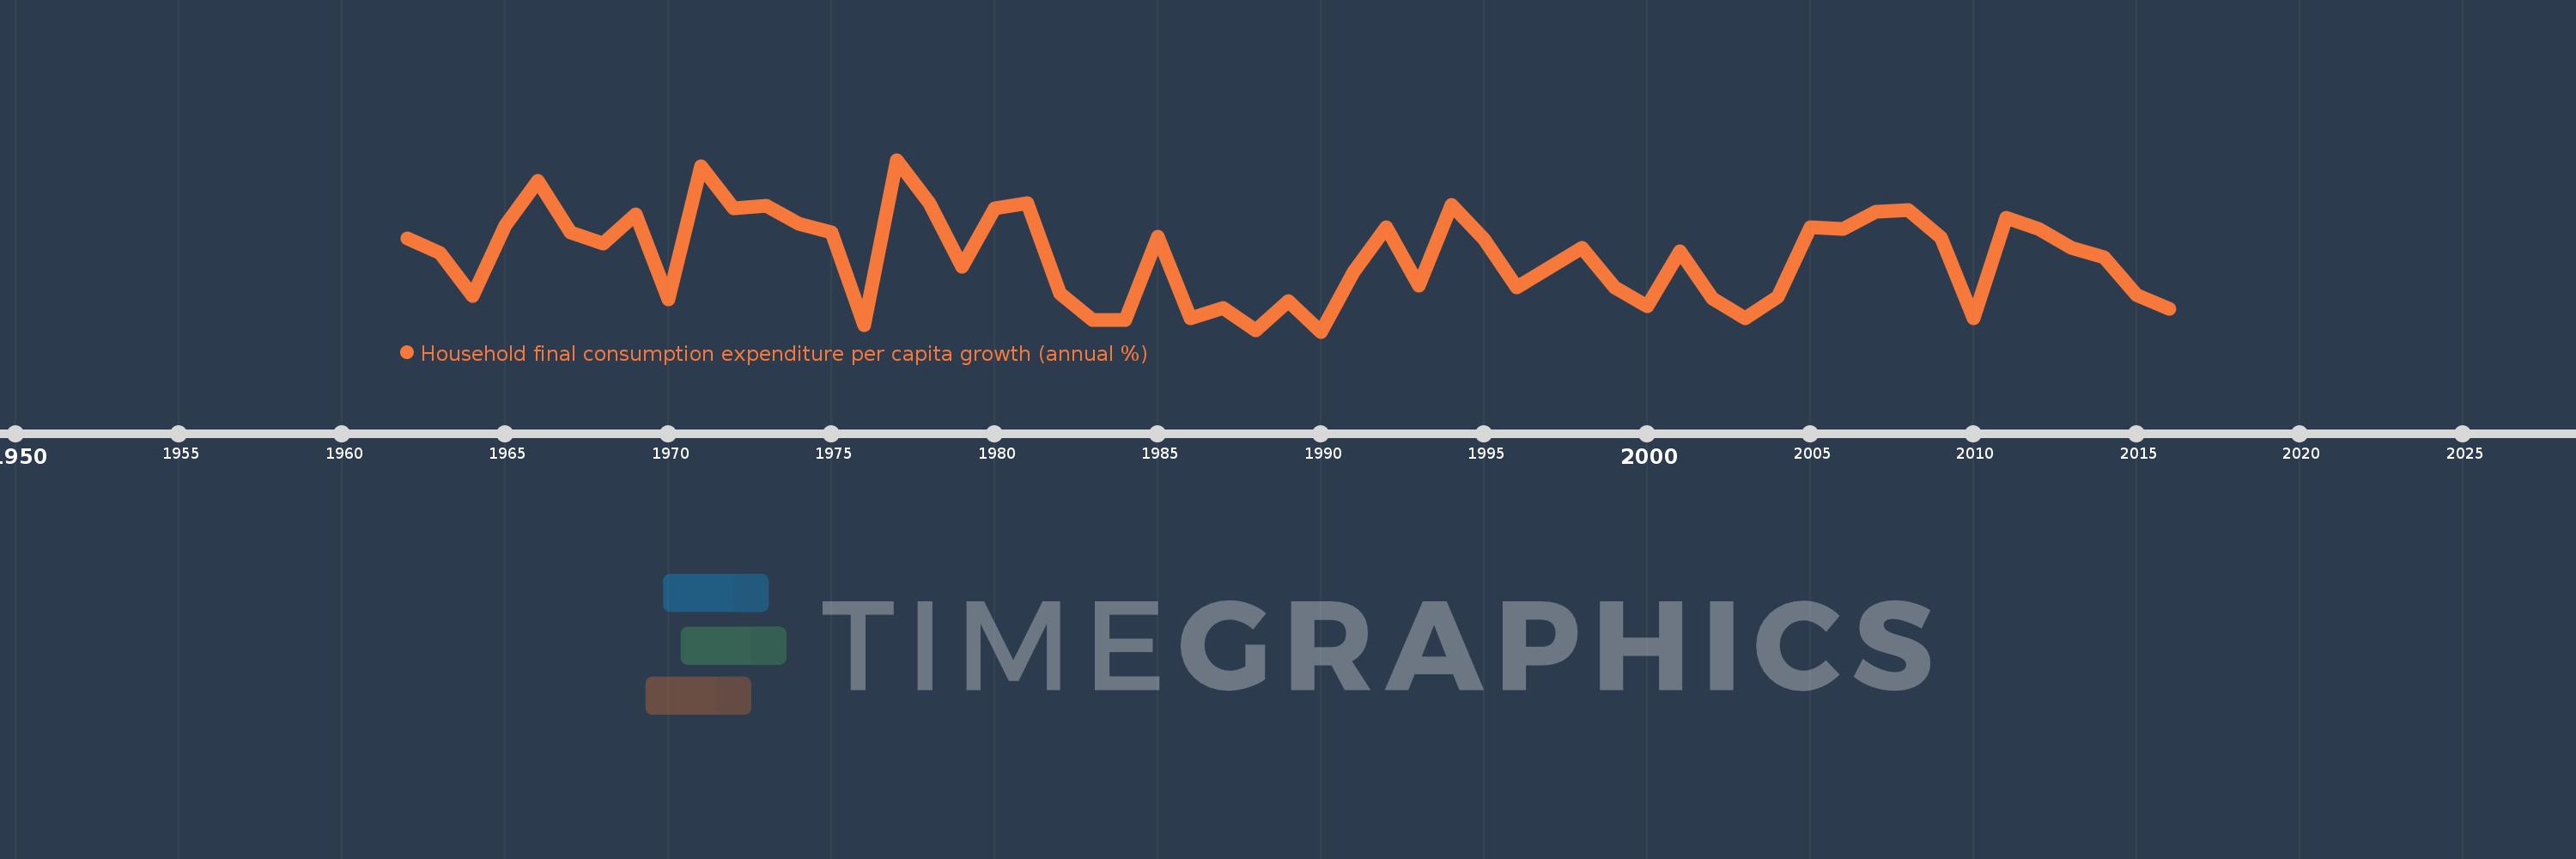
Household final consumption expenditure per capita growth (annual %)
2016,2015,2014,2013,2012,2011,2010,2009,2008,2007,2006,2005,2004,2003,2002,2001,2000,1999,1998,1997,1996,1995,1994,1993,1992,1991,1990,1989,1988,1987,1986,1985,1984,1983,1982,1981,1980,1979,1978,1977,1976,1975,1974,1973,1972,1971,1970,1969,1968,1967,1966,1965,1964,1963,1962
This statistics in other country:
AlbaniaAlgeriaAntigua and BarbudaArab WorldArgentinaArmeniaAustraliaAustriaAzerbaijanBahamas, TheBahrainBangladeshBarbadosBelarusBelgiumBelizeBeninBhutanBoliviaBosnia and HerzegovinaBotswanaBrazilBrunei DarussalamBulgariaBurkina FasoBurundiCabo VerdeCambodiaCameroonCanadaCaribbean small statesCentral Europe and the BalticsChadChileChinaColombiaComorosCongo, Dem. Rep.Congo, Rep.Costa RicaCote d'IvoireCroatiaCubaCyprusCzech RepublicDenmarkDominican RepublicEarly-demographic dividendEast Asia & PacificEast Asia & Pacific (excluding high income)East Asia & Pacific (IDA & IBRD countries)EcuadorEgypt, Arab Rep.El SalvadorEquatorial GuineaEritreaEstoniaEuro areaEurope & Central AsiaEurope & Central Asia (excluding high income)Europe & Central Asia (IDA & IBRD countries)European UnionFinlandFranceGabonGambia, TheGermanyGhanaGreeceGuatemalaGuineaGuinea-BissauHaitiHeavily indebted poor countries (HIPC)High incomeHondurasHong Kong SAR, ChinaHungaryIBRD onlyIcelandIDA & IBRD totalIDA blendIDA onlyIDA totalIndiaIndonesiaIran, Islamic Rep.IrelandIsraelItalyJamaicaJapanJordanKazakhstanKenyaKorea, Rep.KosovoKuwaitKyrgyz RepublicLate-demographic dividendLatin America & Caribbean Latin America & Caribbean (excluding high income)Latin America & the Caribbean (IDA & IBRD countries)LatviaLeast developed countries: UN classificationLebanonLiberiaLithuaniaLow & middle incomeLow incomeLower middle incomeLuxembourgMacao SAR, ChinaMacedonia, FYRMadagascarMalawiMalaysiaMaliMaltaMauritaniaMauritiusMexicoMiddle East & North AfricaMiddle East & North Africa (excluding high income)Middle East & North Africa (IDA & IBRD countries)Middle incomeMoldovaMongoliaMontenegroMoroccoMozambiqueNamibiaNepalNetherlandsNew ZealandNicaraguaNigerNigeriaNorth AmericaNorwayOECD membersOmanOther small statesPakistanPanamaParaguayPeruPhilippinesPolandPortugalPost-demographic dividendPre-demographic dividendPuerto RicoQatarRomaniaRussian FederationRwandaSaudi ArabiaSenegalSerbiaSierra LeoneSingaporeSlovak RepublicSloveniaSmall statesSouth AfricaSouth AsiaSouth Asia (IDA & IBRD)South SudanSpainSri LankaSub-Saharan Africa Sub-Saharan Africa (excluding high income)Sub-Saharan Africa (IDA & IBRD countries)SudanSurinameSwazilandSwedenSwitzerlandTajikistanTanzaniaThailandTimor-LesteTogoTrinidad and TobagoTunisiaTurkeyUgandaUkraineUnited Arab EmiratesUnited KingdomUnited StatesUpper middle incomeUruguayVanuatuVenezuela, RBVietnamWest Bank and GazaWorldZimbabwe Timeline:
This timeline shows a graph from 1962 to 2016 of Latin America & Caribbean . No data until 1961. Number of actual observations by date: 55.
Source name:
World Development Indicators
Source organization:
World Bank national accounts data, and OECD National Accounts data files.
Categories, topics:
Economy & Growth
Last updated:
apr 23, 2017
Indicators value changes by year
Minimum:
-2.317
jan 1, 1990
At the date of observation
Value
Absolute change
Change from previous value
jan 1, 1962
3.408
+3.408
0.0%
jan 1, 1963
2.491
-0.917
-26.92%
jan 1, 1964
-0.104
-2.595
-104.19%
jan 1, 1965
4.197
+4.301
-4.12K%
jan 1, 1966
6.907
+2.71
64.58%
jan 1, 1967
3.786
-3.121
-45.18%
jan 1, 1968
3.089
-0.697
-18.4%
jan 1, 1969
4.85
+1.761
57.0%
jan 1, 1970
-0.332
-5.183
-106.85%
jan 1, 1971
7.824
+8.156
-2.45K%
jan 1, 1972
5.24
-2.583
-33.02%
jan 1, 1973
5.427
+0.187
3.56%
jan 1, 1974
4.293
-1.134
-20.89%
jan 1, 1975
3.795
-0.499
-11.62%
jan 1, 1976
-1.91
-5.705
-150.34%
jan 1, 1977
8.222
+10.132
-530.41%
jan 1, 1978
5.562
-2.66
-32.35%
jan 1, 1979
1.647
-3.915
-70.4%
jan 1, 1980
5.237
+3.591
218.07%
jan 1, 1981
5.579
+0.342
6.52%
jan 1, 1982
0.042
-5.536
-99.24%
jan 1, 1983
-1.606
-1.648
-3.88K%
jan 1, 1984
-1.63
-0.024
1.52%
jan 1, 1985
3.523
+5.153
-316.13%
jan 1, 1986
-1.514
-5.037
-142.98%
jan 1, 1987
-0.845
+0.67
-44.22%
jan 1, 1988
-2.226
-1.381
163.54%
jan 1, 1989
-0.425
+1.801
-80.93%
jan 1, 1990
-2.317
-1.893
445.84%
jan 1, 1991
1.368
+3.686
-159.04%
jan 1, 1992
4.1
+2.731
199.65%
jan 1, 1993
0.488
-3.611
-88.08%
jan 1, 1994
5.462
+4.974
1.02K%
jan 1, 1995
3.333
-2.129
-38.98%
jan 1, 1996
0.395
-2.938
-88.14%
jan 1, 1997
1.584
+1.189
300.94%
jan 1, 1998
2.84
+1.256
79.26%
jan 1, 1999
0.423
-2.418
-85.12%
jan 1, 2000
-0.768
-1.19
-281.76%
jan 1, 2001
2.636
+3.403
-443.18%
jan 1, 2002
-0.295
-2.931
-111.2%
jan 1, 2003
-1.511
-1.216
412.14%
jan 1, 2004
-0.175
+1.336
-88.41%
jan 1, 2005
4.061
+4.236
-2.42K%
jan 1, 2006
3.963
-0.098
-2.41%
jan 1, 2007
5.058
+1.095
27.63%
jan 1, 2008
5.158
+0.1
1.98%
jan 1, 2009
3.471
-1.688
-32.72%
jan 1, 2010
-1.524
-4.994
-143.9%
jan 1, 2011
4.651
+6.174
-405.25%
jan 1, 2012
4.005
-0.646
-13.89%
jan 1, 2013
2.824
-1.181
-29.49%
jan 1, 2014
2.259
-0.565
-20.01%
jan 1, 2015
-0.089
-2.348
-103.92%
jan 1, 2016
-0.946
-0.857
967.11%
Ranking of countries by current statistics by years


Comments: