29
/
en
AIzaSyAYiBZKx7MnpbEhh9jyipgxe19OcubqV5w
April 1, 2024
187886
Malaysia
MYS
true
2
1
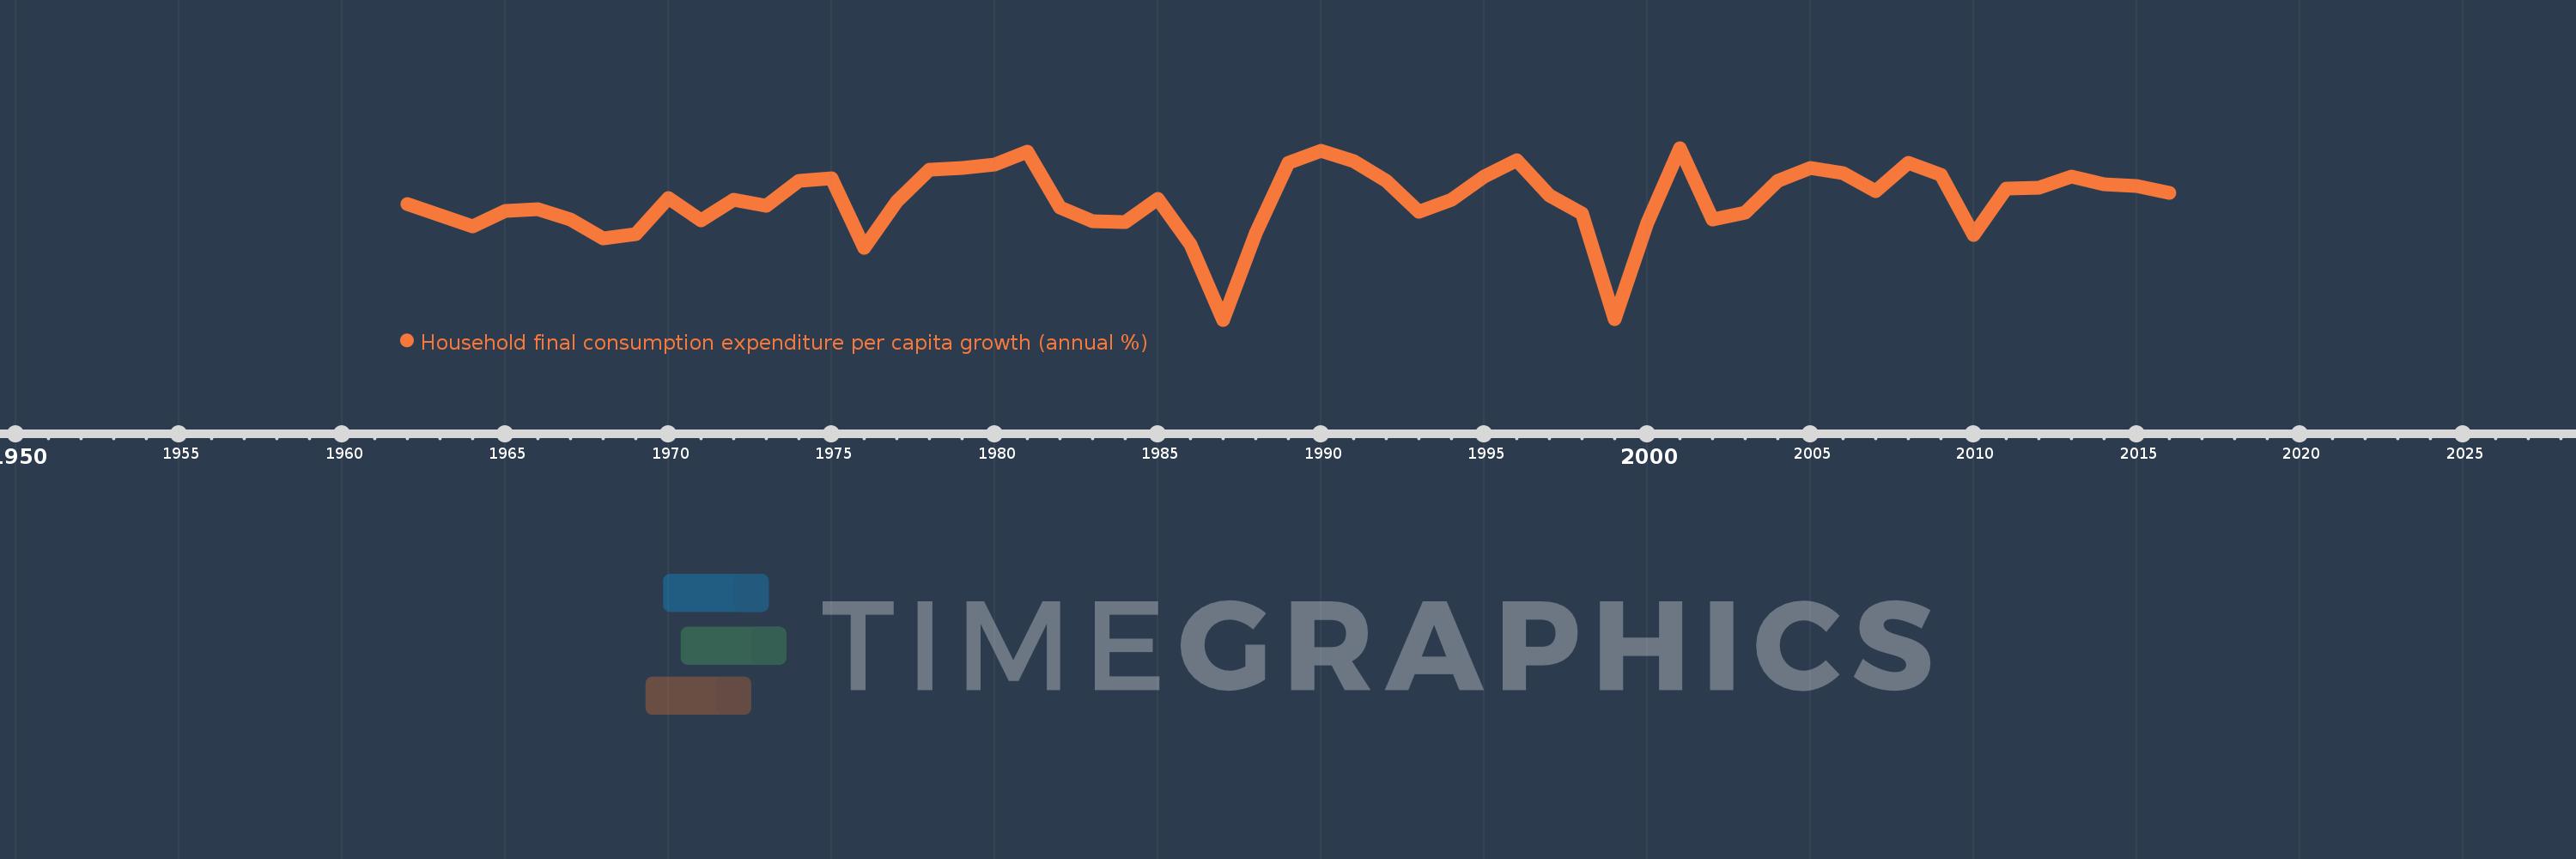
Household final consumption expenditure per capita growth (annual %)
2016,2015,2014,2013,2012,2011,2010,2009,2008,2007,2006,2005,2004,2003,2002,2001,2000,1999,1998,1997,1996,1995,1994,1993,1992,1991,1990,1989,1988,1987,1986,1985,1984,1983,1982,1981,1980,1979,1978,1977,1976,1975,1974,1973,1972,1971,1970,1969,1968,1967,1966,1965,1964,1963,1962
This statistics in other country:
AlbaniaAlgeriaAntigua and BarbudaArab WorldArgentinaArmeniaAustraliaAustriaAzerbaijanBahamas, TheBahrainBangladeshBarbadosBelarusBelgiumBelizeBeninBhutanBoliviaBosnia and HerzegovinaBotswanaBrazilBrunei DarussalamBulgariaBurkina FasoBurundiCabo VerdeCambodiaCameroonCanadaCaribbean small statesCentral Europe and the BalticsChadChileChinaColombiaComorosCongo, Dem. Rep.Congo, Rep.Costa RicaCote d'IvoireCroatiaCubaCyprusCzech RepublicDenmarkDominican RepublicEarly-demographic dividendEast Asia & PacificEast Asia & Pacific (excluding high income)East Asia & Pacific (IDA & IBRD countries)EcuadorEgypt, Arab Rep.El SalvadorEquatorial GuineaEritreaEstoniaEuro areaEurope & Central AsiaEurope & Central Asia (excluding high income)Europe & Central Asia (IDA & IBRD countries)European UnionFinlandFranceGabonGambia, TheGermanyGhanaGreeceGuatemalaGuineaGuinea-BissauHaitiHeavily indebted poor countries (HIPC)High incomeHondurasHong Kong SAR, ChinaHungaryIBRD onlyIcelandIDA & IBRD totalIDA blendIDA onlyIDA totalIndiaIndonesiaIran, Islamic Rep.IrelandIsraelItalyJamaicaJapanJordanKazakhstanKenyaKorea, Rep.KosovoKuwaitKyrgyz RepublicLate-demographic dividendLatin America & Caribbean Latin America & Caribbean (excluding high income)Latin America & the Caribbean (IDA & IBRD countries)LatviaLeast developed countries: UN classificationLebanonLiberiaLithuaniaLow & middle incomeLow incomeLower middle incomeLuxembourgMacao SAR, ChinaMacedonia, FYRMadagascarMalawiMalaysiaMaliMaltaMauritaniaMauritiusMexicoMiddle East & North AfricaMiddle East & North Africa (excluding high income)Middle East & North Africa (IDA & IBRD countries)Middle incomeMoldovaMongoliaMontenegroMoroccoMozambiqueNamibiaNepalNetherlandsNew ZealandNicaraguaNigerNigeriaNorth AmericaNorwayOECD membersOmanOther small statesPakistanPanamaParaguayPeruPhilippinesPolandPortugalPost-demographic dividendPre-demographic dividendPuerto RicoQatarRomaniaRussian FederationRwandaSaudi ArabiaSenegalSerbiaSierra LeoneSingaporeSlovak RepublicSloveniaSmall statesSouth AfricaSouth AsiaSouth Asia (IDA & IBRD)South SudanSpainSri LankaSub-Saharan Africa Sub-Saharan Africa (excluding high income)Sub-Saharan Africa (IDA & IBRD countries)SudanSurinameSwazilandSwedenSwitzerlandTajikistanTanzaniaThailandTimor-LesteTogoTrinidad and TobagoTunisiaTurkeyUgandaUkraineUnited Arab EmiratesUnited KingdomUnited StatesUpper middle incomeUruguayVanuatuVenezuela, RBVietnamWest Bank and GazaWorldZimbabwe Timeline:
This timeline shows a graph from 1962 to 2016 of Malaysia. No data until 1961. Number of actual observations by date: 55.
Source name:
World Development Indicators
Source organization:
World Bank national accounts data, and OECD National Accounts data files.
Categories, topics:
Economy & Growth
Last updated:
apr 23, 2017
Indicators value changes by year
Minimum:
-12.547
jan 1, 1987
Maximum:
10.508
jan 1, 2001
At the date of observation
Value
Absolute change
Change from previous value
jan 1, 1962
2.951
+2.951
0.0%
jan 1, 1963
1.49
-1.461
-49.52%
jan 1, 1964
-0.053
-1.542
-103.54%
jan 1, 1965
2.011
+2.064
-3.91K%
jan 1, 1966
2.257
+0.246
12.21%
jan 1, 1967
0.914
-1.343
-59.52%
jan 1, 1968
-1.68
-2.594
-283.89%
jan 1, 1969
-1.029
+0.651
-38.76%
jan 1, 1970
3.81
+4.839
-470.34%
jan 1, 1971
0.842
-2.968
-77.89%
jan 1, 1972
3.555
+2.713
322.02%
jan 1, 1973
2.72
-0.835
-23.49%
jan 1, 1974
6.149
+3.429
126.07%
jan 1, 1975
6.424
+0.275
4.47%
jan 1, 1976
-2.895
-9.319
-145.06%
jan 1, 1977
3.292
+6.187
-213.71%
jan 1, 1978
7.645
+4.353
132.23%
jan 1, 1979
7.836
+0.191
2.49%
jan 1, 1980
8.229
+0.393
5.02%
jan 1, 1981
9.978
+1.75
21.26%
jan 1, 1982
2.51
-7.468
-74.84%
jan 1, 1983
0.708
-1.802
-71.79%
jan 1, 1984
0.535
-0.173
-24.49%
jan 1, 1985
3.63
+3.095
578.79%
jan 1, 1986
-2.4
-6.03
-166.13%
jan 1, 1987
-12.547
-10.147
422.78%
jan 1, 1988
-0.884
+11.663
-92.96%
jan 1, 1989
8.522
+9.405
-1.06K%
jan 1, 1990
10.09
+1.568
18.4%
jan 1, 1991
8.791
-1.299
-12.88%
jan 1, 1992
6.139
-2.652
-30.17%
jan 1, 1993
1.957
-4.182
-68.12%
jan 1, 1994
3.578
+1.621
82.81%
jan 1, 1995
6.654
+3.076
85.99%
jan 1, 1996
8.859
+2.205
33.14%
jan 1, 1997
4.173
-4.686
-52.89%
jan 1, 1998
1.693
-2.481
-59.44%
jan 1, 1999
-12.444
-14.137
-835.22%
jan 1, 2000
0.432
+12.876
-103.47%
jan 1, 2001
10.508
+10.076
2.33K%
jan 1, 2002
0.873
-9.635
-91.69%
jan 1, 2003
1.825
+0.952
109.0%
jan 1, 2004
6.081
+4.257
233.3%
jan 1, 2005
7.843
+1.762
28.97%
jan 1, 2006
7.146
-0.697
-8.88%
jan 1, 2007
4.715
-2.431
-34.02%
jan 1, 2008
8.512
+3.797
80.54%
jan 1, 2009
6.853
-1.659
-19.49%
jan 1, 2010
-1.131
-7.985
-116.51%
jan 1, 2011
5.026
+6.157
-544.22%
jan 1, 2012
5.184
+0.158
3.14%
jan 1, 2013
6.663
+1.479
28.53%
jan 1, 2014
5.639
-1.024
-15.37%
jan 1, 2015
5.417
-0.222
-3.93%
jan 1, 2016
4.506
-0.911
-16.82%
Ranking of countries by current statistics by years


Comments: