29
/
en
AIzaSyAYiBZKx7MnpbEhh9jyipgxe19OcubqV5w
April 1, 2024
50088
Middle East & North Africa (IDA & IBRD countries)
TMN
false
2
1
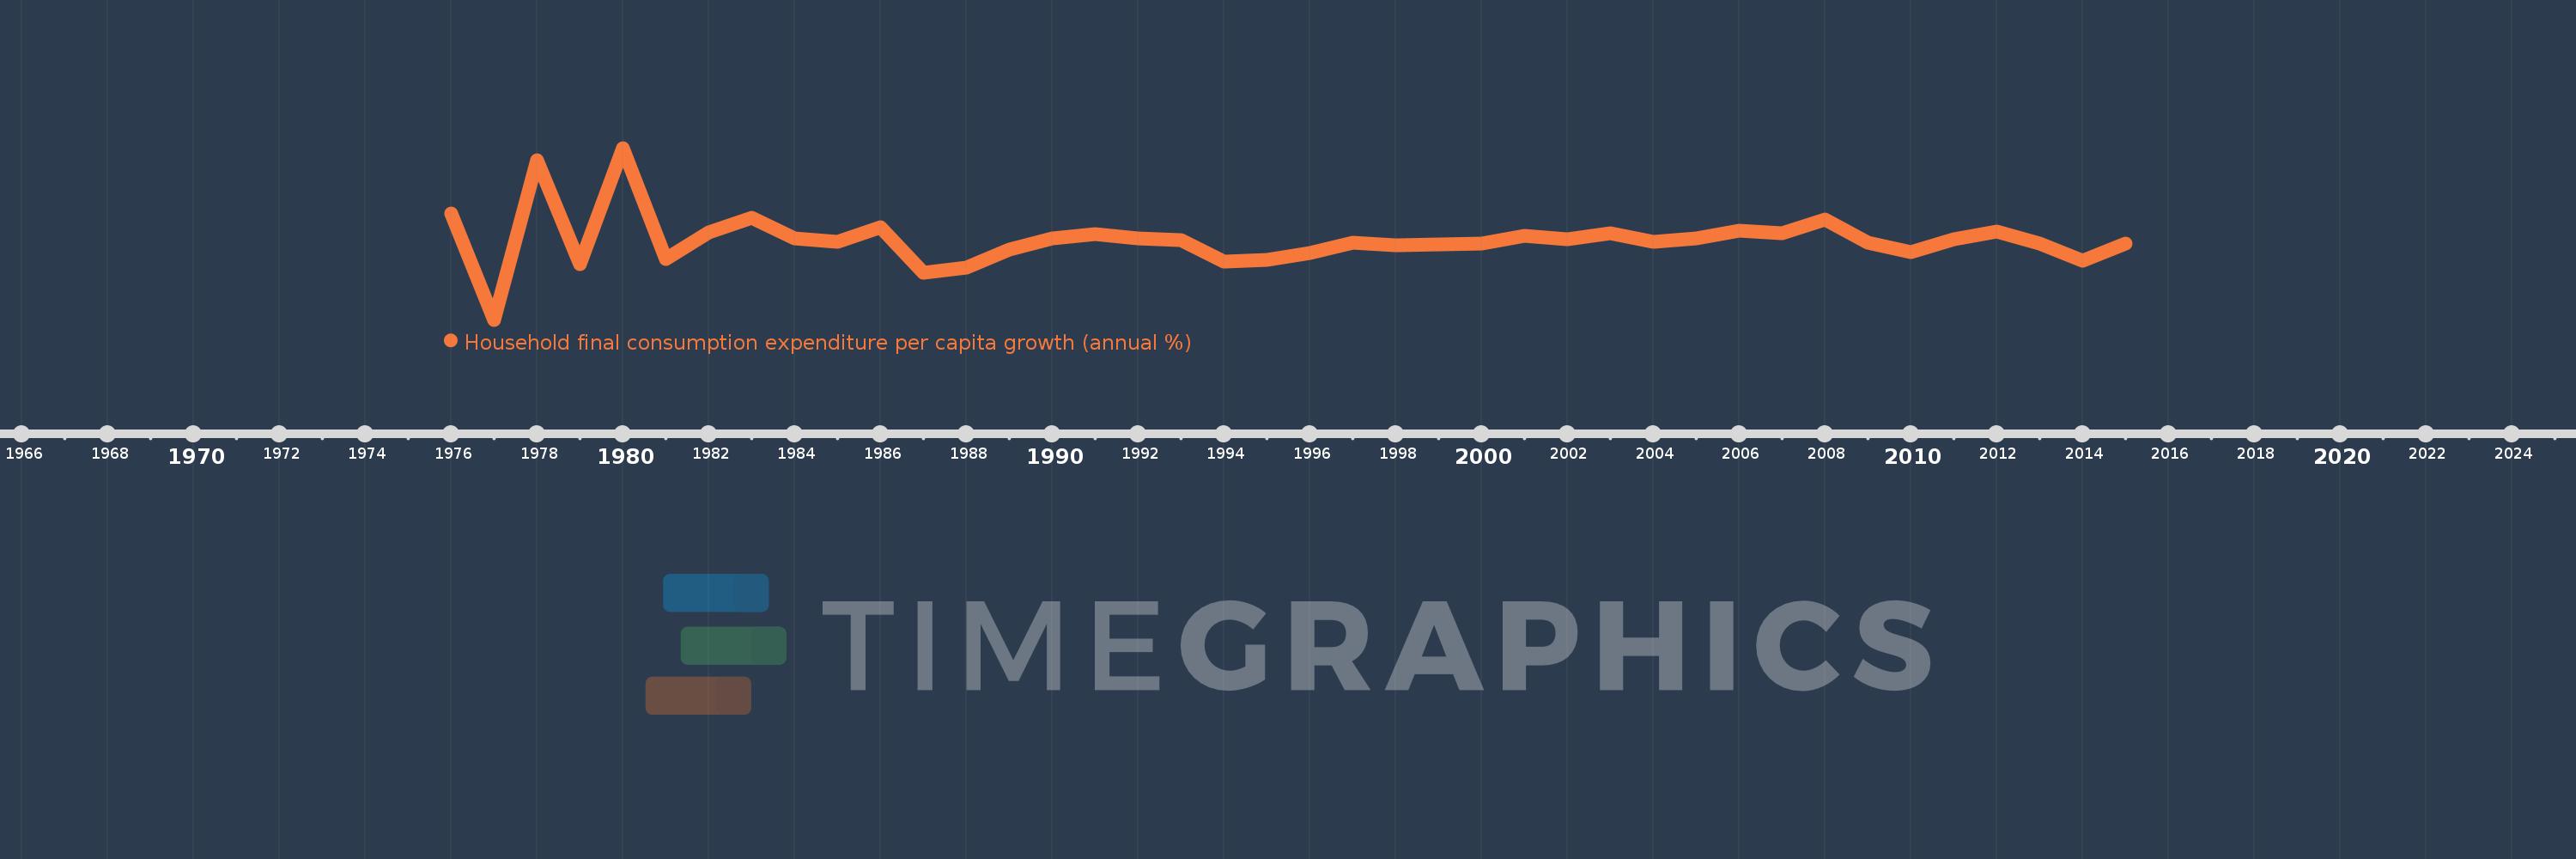
Household final consumption expenditure per capita growth (annual %)
2015,2014,2013,2012,2011,2010,2009,2008,2007,2006,2005,2004,2003,2002,2001,2000,1999,1998,1997,1996,1995,1994,1993,1992,1991,1990,1989,1988,1987,1986,1985,1984,1983,1982,1981,1980,1979,1978,1977,1976
This statistics in other country:
AlbaniaAlgeriaAntigua and BarbudaArab WorldArgentinaArmeniaAustraliaAustriaAzerbaijanBahamas, TheBahrainBangladeshBarbadosBelarusBelgiumBelizeBeninBhutanBoliviaBosnia and HerzegovinaBotswanaBrazilBrunei DarussalamBulgariaBurkina FasoBurundiCabo VerdeCambodiaCameroonCanadaCaribbean small statesCentral Europe and the BalticsChadChileChinaColombiaComorosCongo, Dem. Rep.Congo, Rep.Costa RicaCote d'IvoireCroatiaCubaCyprusCzech RepublicDenmarkDominican RepublicEarly-demographic dividendEast Asia & PacificEast Asia & Pacific (excluding high income)East Asia & Pacific (IDA & IBRD countries)EcuadorEgypt, Arab Rep.El SalvadorEquatorial GuineaEritreaEstoniaEuro areaEurope & Central AsiaEurope & Central Asia (excluding high income)Europe & Central Asia (IDA & IBRD countries)European UnionFinlandFranceGabonGambia, TheGermanyGhanaGreeceGuatemalaGuineaGuinea-BissauHaitiHeavily indebted poor countries (HIPC)High incomeHondurasHong Kong SAR, ChinaHungaryIBRD onlyIcelandIDA & IBRD totalIDA blendIDA onlyIDA totalIndiaIndonesiaIran, Islamic Rep.IrelandIsraelItalyJamaicaJapanJordanKazakhstanKenyaKorea, Rep.KosovoKuwaitKyrgyz RepublicLate-demographic dividendLatin America & Caribbean Latin America & Caribbean (excluding high income)Latin America & the Caribbean (IDA & IBRD countries)LatviaLeast developed countries: UN classificationLebanonLiberiaLithuaniaLow & middle incomeLow incomeLower middle incomeLuxembourgMacao SAR, ChinaMacedonia, FYRMadagascarMalawiMalaysiaMaliMaltaMauritaniaMauritiusMexicoMiddle East & North AfricaMiddle East & North Africa (excluding high income)Middle East & North Africa (IDA & IBRD countries)Middle incomeMoldovaMongoliaMontenegroMoroccoMozambiqueNamibiaNepalNetherlandsNew ZealandNicaraguaNigerNigeriaNorth AmericaNorwayOECD membersOmanOther small statesPakistanPanamaParaguayPeruPhilippinesPolandPortugalPost-demographic dividendPre-demographic dividendPuerto RicoQatarRomaniaRussian FederationRwandaSaudi ArabiaSenegalSerbiaSierra LeoneSingaporeSlovak RepublicSloveniaSmall statesSouth AfricaSouth AsiaSouth Asia (IDA & IBRD)South SudanSpainSri LankaSub-Saharan Africa Sub-Saharan Africa (excluding high income)Sub-Saharan Africa (IDA & IBRD countries)SudanSurinameSwazilandSwedenSwitzerlandTajikistanTanzaniaThailandTimor-LesteTogoTrinidad and TobagoTunisiaTurkeyUgandaUkraineUnited Arab EmiratesUnited KingdomUnited StatesUpper middle incomeUruguayVanuatuVenezuela, RBVietnamWest Bank and GazaWorldZimbabwe Timeline:
This timeline shows a graph from 1976 to 2015 of Middle East & North Africa (IDA & IBRD countries). No data until 1975. Number of actual observations by date: 40.
Source name:
World Development Indicators
Source organization:
World Bank national accounts data, and OECD National Accounts data files.
Categories, topics:
Economy & Growth
Last updated:
apr 23, 2017
Indicators value changes by year
Minimum:
-18.368
jan 1, 1977
Maximum:
26.119
jan 1, 1980
At the date of observation
Value
Absolute change
Change from previous value
jan 1, 1976
9.137
+9.137
0.0%
jan 1, 1977
-18.368
-27.505
-301.03%
jan 1, 1978
22.974
+41.342
-225.08%
jan 1, 1979
-3.953
-26.927
-117.21%
jan 1, 1980
26.119
+30.073
-760.7%
jan 1, 1981
-2.682
-28.801
-110.27%
jan 1, 1982
4.149
+6.831
-254.68%
jan 1, 1983
8.074
+3.925
94.61%
jan 1, 1984
2.688
-5.386
-66.71%
jan 1, 1985
1.709
-0.979
-36.43%
jan 1, 1986
5.502
+3.793
221.98%
jan 1, 1987
-6.239
-11.74
-213.4%
jan 1, 1988
-4.957
+1.281
-20.54%
jan 1, 1989
-0.09
+4.867
-98.19%
jan 1, 1990
2.595
+2.685
-2.99K%
jan 1, 1991
3.745
+1.15
44.33%
jan 1, 1992
2.663
-1.082
-28.89%
jan 1, 1993
2.281
-0.382
-14.34%
jan 1, 1994
-3.222
-5.503
-241.21%
jan 1, 1995
-2.952
+0.27
-8.37%
jan 1, 1996
-1.008
+1.944
-65.85%
jan 1, 1997
1.481
+2.489
-246.89%
jan 1, 1998
0.943
-0.538
-36.31%
jan 1, 1999
1.109
+0.166
17.56%
jan 1, 2000
1.309
+0.201
18.12%
jan 1, 2001
3.475
+2.166
165.4%
jan 1, 2002
2.429
-1.046
-30.1%
jan 1, 2003
4.036
+1.607
66.15%
jan 1, 2004
1.802
-2.234
-55.36%
jan 1, 2005
2.652
+0.85
47.16%
jan 1, 2006
4.766
+2.115
79.74%
jan 1, 2007
4.036
-0.73
-15.33%
jan 1, 2008
7.701
+3.665
90.81%
jan 1, 2009
1.512
-6.189
-80.37%
jan 1, 2010
-0.833
-2.344
-155.09%
jan 1, 2011
2.529
+3.362
-403.69%
jan 1, 2012
4.572
+2.043
80.78%
jan 1, 2013
1.371
-3.201
-70.01%
jan 1, 2014
-3.048
-4.419
-322.29%
jan 1, 2015
1.303
+4.351
-142.75%
Ranking of countries by current statistics by years


Comments: