29
/
en
AIzaSyAYiBZKx7MnpbEhh9jyipgxe19OcubqV5w
April 1, 2024
223662
Philippines
PHL
true
2
1
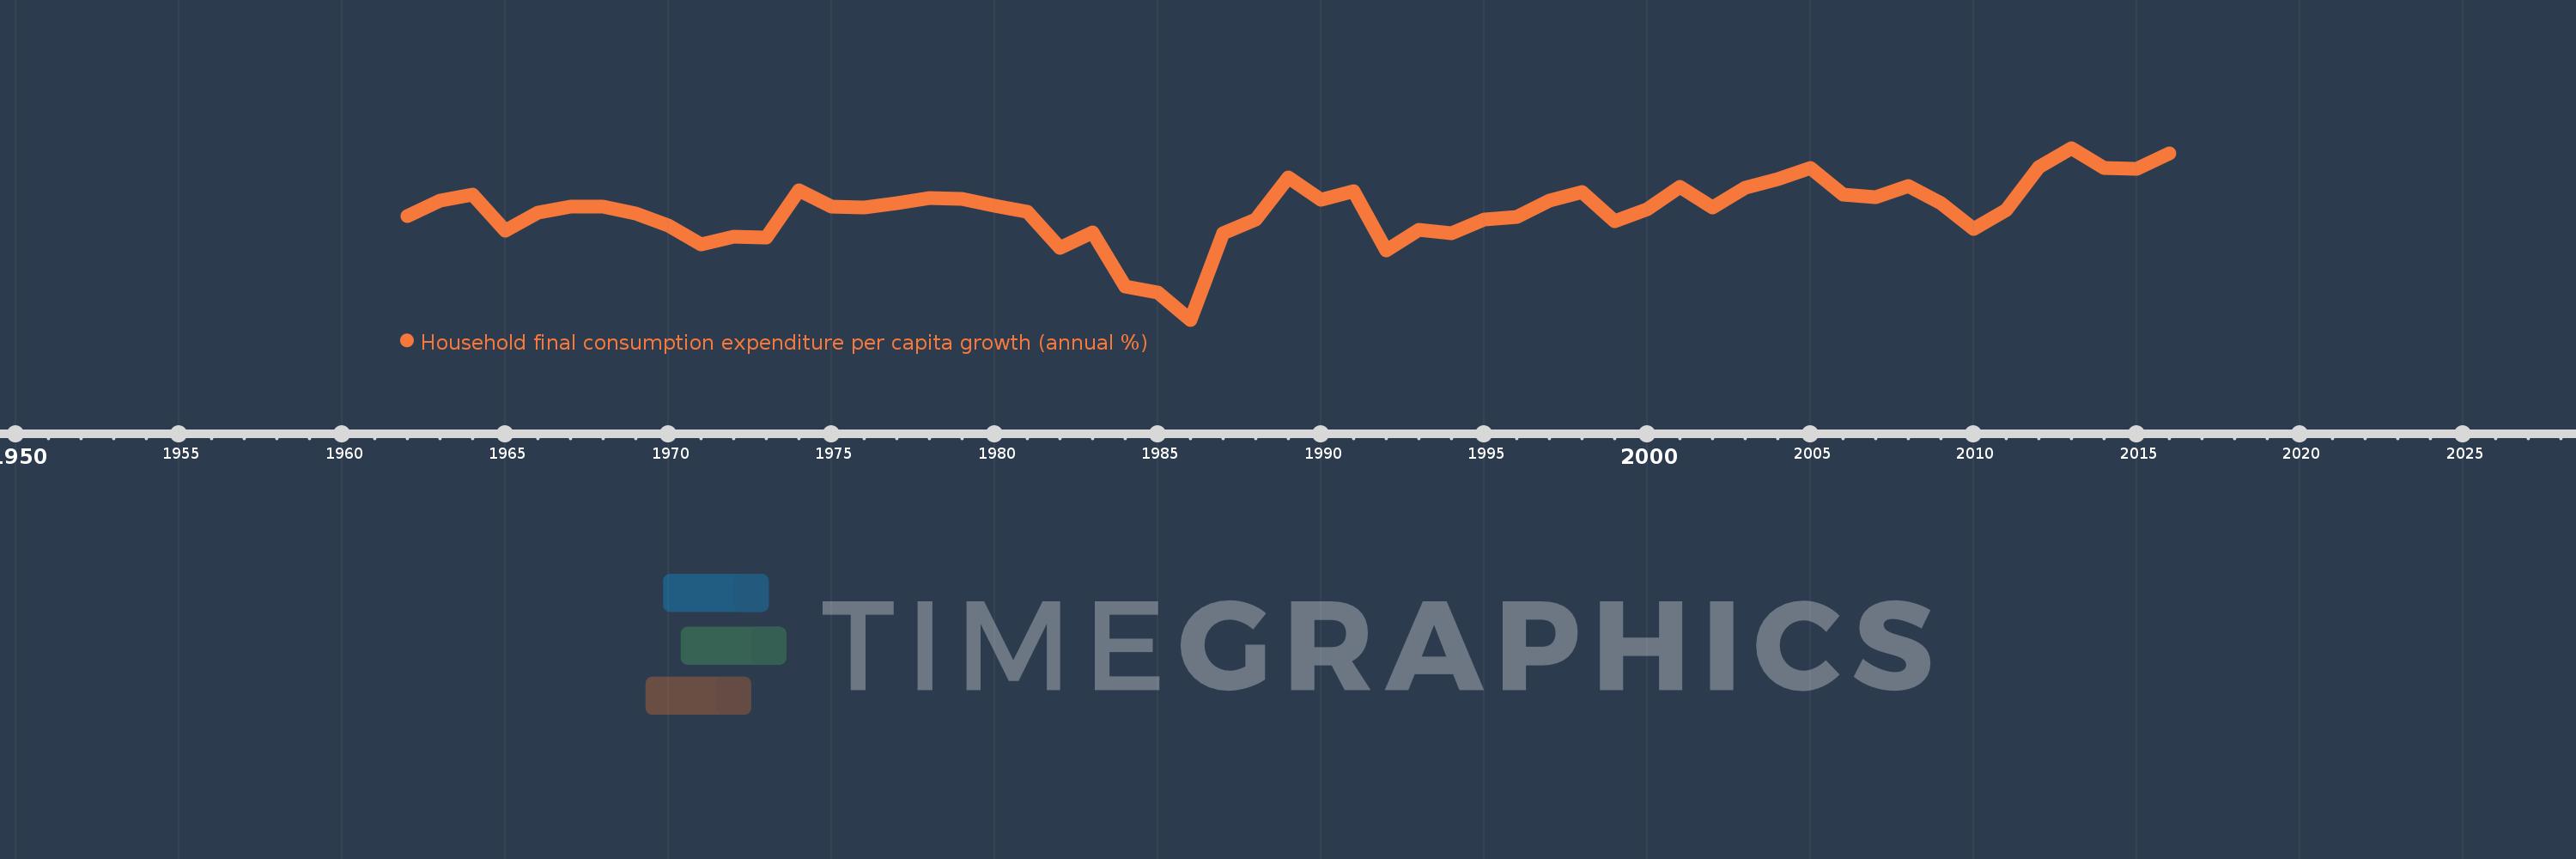
Household final consumption expenditure per capita growth (annual %)
2016,2015,2014,2013,2012,2011,2010,2009,2008,2007,2006,2005,2004,2003,2002,2001,2000,1999,1998,1997,1996,1995,1994,1993,1992,1991,1990,1989,1988,1987,1986,1985,1984,1983,1982,1981,1980,1979,1978,1977,1976,1975,1974,1973,1972,1971,1970,1969,1968,1967,1966,1965,1964,1963,1962
This statistics in other country:
AlbaniaAlgeriaAntigua and BarbudaArab WorldArgentinaArmeniaAustraliaAustriaAzerbaijanBahamas, TheBahrainBangladeshBarbadosBelarusBelgiumBelizeBeninBhutanBoliviaBosnia and HerzegovinaBotswanaBrazilBrunei DarussalamBulgariaBurkina FasoBurundiCabo VerdeCambodiaCameroonCanadaCaribbean small statesCentral Europe and the BalticsChadChileChinaColombiaComorosCongo, Dem. Rep.Congo, Rep.Costa RicaCote d'IvoireCroatiaCubaCyprusCzech RepublicDenmarkDominican RepublicEarly-demographic dividendEast Asia & PacificEast Asia & Pacific (excluding high income)East Asia & Pacific (IDA & IBRD countries)EcuadorEgypt, Arab Rep.El SalvadorEquatorial GuineaEritreaEstoniaEuro areaEurope & Central AsiaEurope & Central Asia (excluding high income)Europe & Central Asia (IDA & IBRD countries)European UnionFinlandFranceGabonGambia, TheGermanyGhanaGreeceGuatemalaGuineaGuinea-BissauHaitiHeavily indebted poor countries (HIPC)High incomeHondurasHong Kong SAR, ChinaHungaryIBRD onlyIcelandIDA & IBRD totalIDA blendIDA onlyIDA totalIndiaIndonesiaIran, Islamic Rep.IrelandIsraelItalyJamaicaJapanJordanKazakhstanKenyaKorea, Rep.KosovoKuwaitKyrgyz RepublicLate-demographic dividendLatin America & Caribbean Latin America & Caribbean (excluding high income)Latin America & the Caribbean (IDA & IBRD countries)LatviaLeast developed countries: UN classificationLebanonLiberiaLithuaniaLow & middle incomeLow incomeLower middle incomeLuxembourgMacao SAR, ChinaMacedonia, FYRMadagascarMalawiMalaysiaMaliMaltaMauritaniaMauritiusMexicoMiddle East & North AfricaMiddle East & North Africa (excluding high income)Middle East & North Africa (IDA & IBRD countries)Middle incomeMoldovaMongoliaMontenegroMoroccoMozambiqueNamibiaNepalNetherlandsNew ZealandNicaraguaNigerNigeriaNorth AmericaNorwayOECD membersOmanOther small statesPakistanPanamaParaguayPeruPhilippinesPolandPortugalPost-demographic dividendPre-demographic dividendPuerto RicoQatarRomaniaRussian FederationRwandaSaudi ArabiaSenegalSerbiaSierra LeoneSingaporeSlovak RepublicSloveniaSmall statesSouth AfricaSouth AsiaSouth Asia (IDA & IBRD)South SudanSpainSri LankaSub-Saharan Africa Sub-Saharan Africa (excluding high income)Sub-Saharan Africa (IDA & IBRD countries)SudanSurinameSwazilandSwedenSwitzerlandTajikistanTanzaniaThailandTimor-LesteTogoTrinidad and TobagoTunisiaTurkeyUgandaUkraineUnited Arab EmiratesUnited KingdomUnited StatesUpper middle incomeUruguayVanuatuVenezuela, RBVietnamWest Bank and GazaWorldZimbabwe Timeline:
This timeline shows a graph from 1962 to 2016 of Philippines. No data until 1961. Number of actual observations by date: 55.
Source name:
World Development Indicators
Source organization:
World Bank national accounts data, and OECD National Accounts data files.
Categories, topics:
Economy & Growth
Last updated:
apr 23, 2017
Indicators value changes by year
Minimum:
-3.797
jan 1, 1986
At the date of observation
Value
Absolute change
Change from previous value
jan 1, 1962
1.458
+1.458
0.0%
jan 1, 1963
2.25
+0.792
54.35%
jan 1, 1964
2.582
+0.332
14.76%
jan 1, 1965
0.716
-1.866
-72.27%
jan 1, 1966
1.672
+0.956
133.49%
jan 1, 1967
1.954
+0.282
16.87%
jan 1, 1968
1.974
+0.02
1.04%
jan 1, 1969
1.629
-0.345
-17.47%
jan 1, 1970
1.005
-0.624
-38.32%
jan 1, 1971
0.04
-0.965
-96.0%
jan 1, 1972
0.446
+0.406
1.01K%
jan 1, 1973
0.373
-0.073
-16.37%
jan 1, 1974
2.776
+2.402
643.94%
jan 1, 1975
1.951
-0.825
-29.71%
jan 1, 1976
1.893
-0.058
-2.98%
jan 1, 1977
2.115
+0.222
11.75%
jan 1, 1978
2.406
+0.291
13.77%
jan 1, 1979
2.362
-0.045
-1.86%
jan 1, 1980
2.012
-0.349
-14.79%
jan 1, 1981
1.679
-0.334
-16.57%
jan 1, 1982
-0.123
-1.802
-107.32%
jan 1, 1983
0.663
+0.786
-639.23%
jan 1, 1984
-2.103
-2.766
-417.23%
jan 1, 1985
-2.424
-0.321
15.27%
jan 1, 1986
-3.797
-1.373
56.63%
jan 1, 1987
0.582
+4.379
-115.33%
jan 1, 1988
1.302
+0.72
123.72%
jan 1, 1989
3.463
+2.161
166.02%
jan 1, 1990
2.317
-1.147
-33.11%
jan 1, 1991
2.734
+0.417
18.01%
jan 1, 1992
-0.256
-2.99
-109.38%
jan 1, 1993
0.769
+1.026
-400.09%
jan 1, 1994
0.605
-0.164
-21.32%
jan 1, 1995
1.31
+0.704
116.32%
jan 1, 1996
1.441
+0.131
10.01%
jan 1, 1997
2.278
+0.837
58.12%
jan 1, 1998
2.683
+0.405
17.78%
jan 1, 1999
1.211
-1.472
-54.86%
jan 1, 2000
1.807
+0.596
49.2%
jan 1, 2001
2.974
+1.167
64.59%
jan 1, 2002
1.898
-1.076
-36.17%
jan 1, 2003
2.924
+1.026
54.03%
jan 1, 2004
3.362
+0.438
14.98%
jan 1, 2005
3.936
+0.574
17.07%
jan 1, 2006
2.551
-1.384
-35.17%
jan 1, 2007
2.456
-0.096
-3.75%
jan 1, 2008
2.996
+0.54
21.99%
jan 1, 2009
2.151
-0.845
-28.2%
jan 1, 2010
0.832
-1.319
-61.34%
jan 1, 2011
1.799
+0.967
116.31%
jan 1, 2012
3.956
+2.158
119.96%
jan 1, 2013
4.943
+0.987
24.95%
jan 1, 2014
3.943
-1.001
-20.24%
jan 1, 2015
3.867
-0.075
-1.91%
jan 1, 2016
4.652
+0.784
20.28%
Ranking of countries by current statistics by years


Comments: