29
/
en
AIzaSyAYiBZKx7MnpbEhh9jyipgxe19OcubqV5w
April 1, 2024
58163
South Asia (IDA & IBRD)
TSA
false
2
1
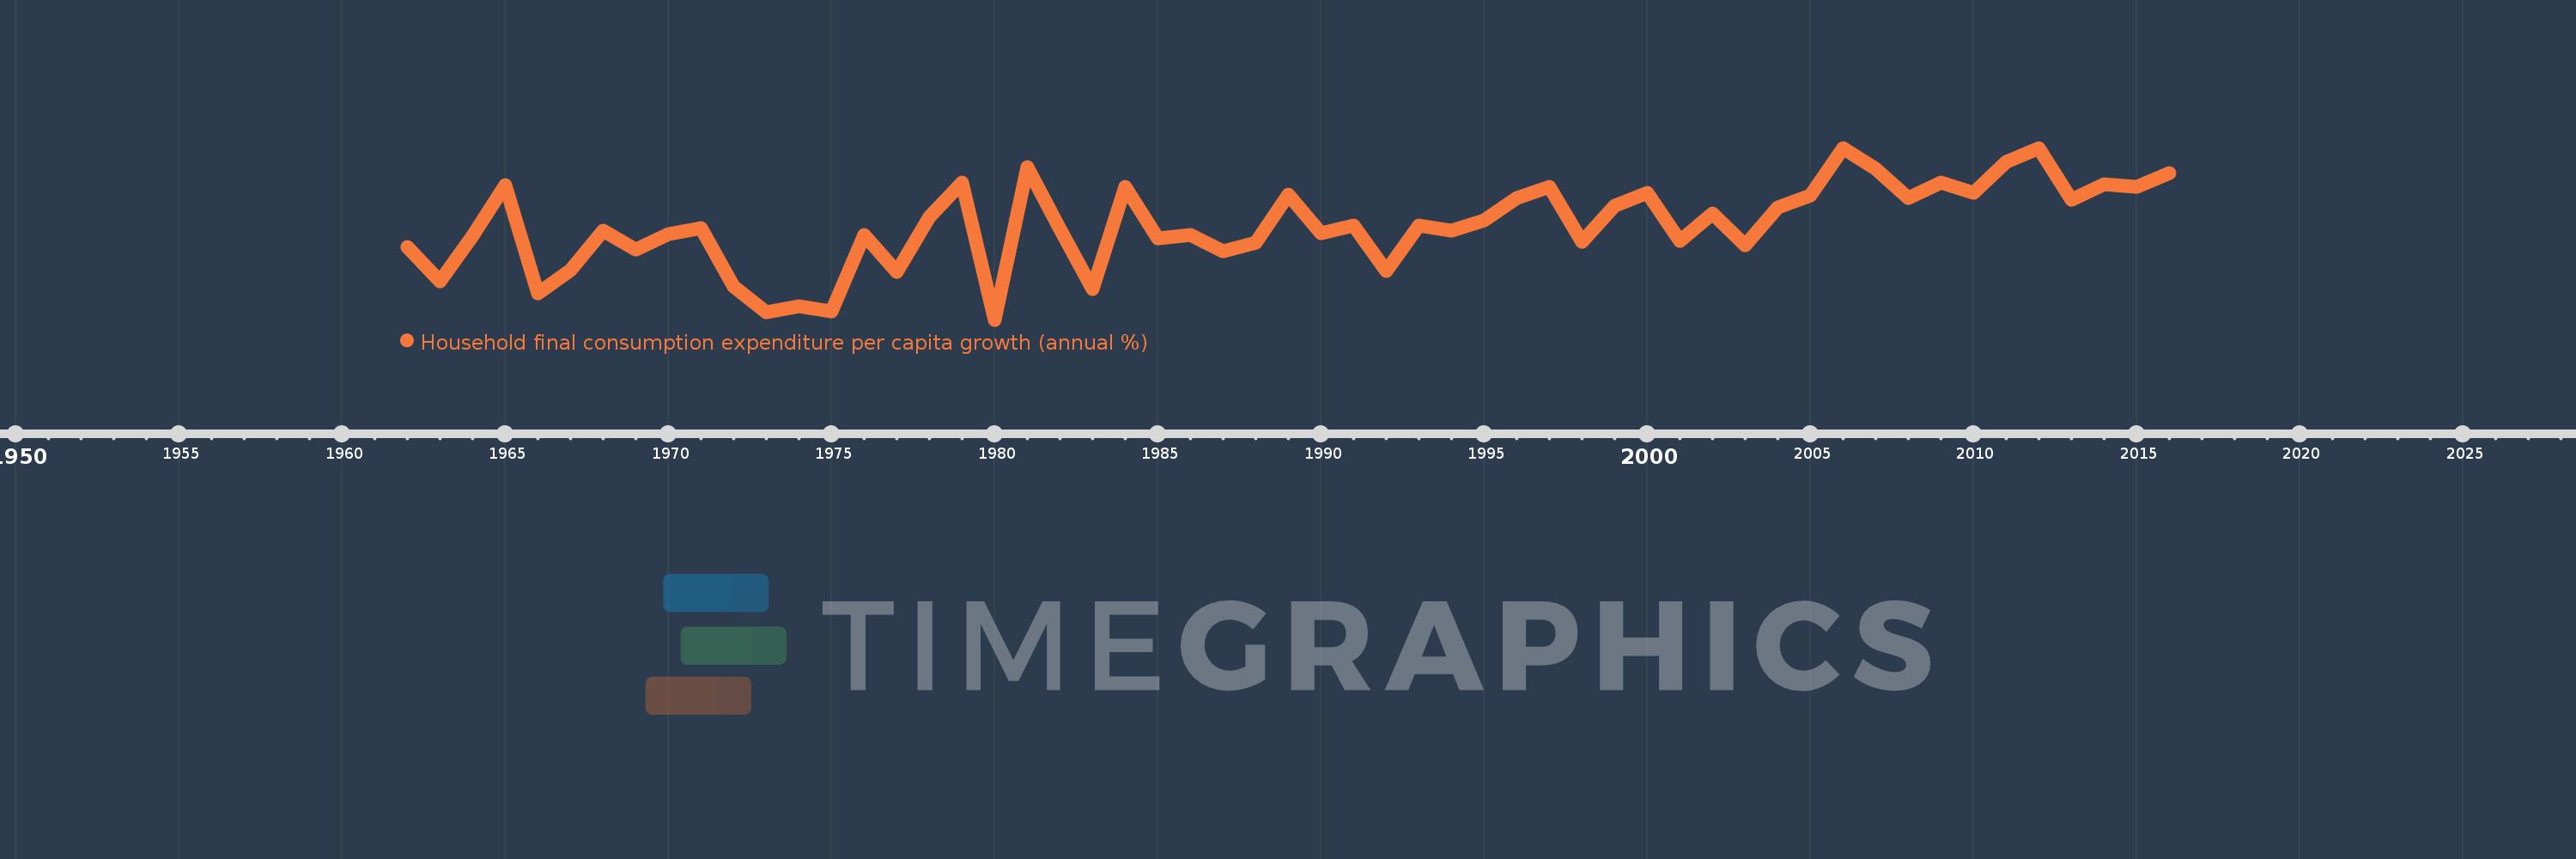
Household final consumption expenditure per capita growth (annual %)
2016,2015,2014,2013,2012,2011,2010,2009,2008,2007,2006,2005,2004,2003,2002,2001,2000,1999,1998,1997,1996,1995,1994,1993,1992,1991,1990,1989,1988,1987,1986,1985,1984,1983,1982,1981,1980,1979,1978,1977,1976,1975,1974,1973,1972,1971,1970,1969,1968,1967,1966,1965,1964,1963,1962
This statistics in other country:
AlbaniaAlgeriaAntigua and BarbudaArab WorldArgentinaArmeniaAustraliaAustriaAzerbaijanBahamas, TheBahrainBangladeshBarbadosBelarusBelgiumBelizeBeninBhutanBoliviaBosnia and HerzegovinaBotswanaBrazilBrunei DarussalamBulgariaBurkina FasoBurundiCabo VerdeCambodiaCameroonCanadaCaribbean small statesCentral Europe and the BalticsChadChileChinaColombiaComorosCongo, Dem. Rep.Congo, Rep.Costa RicaCote d'IvoireCroatiaCubaCyprusCzech RepublicDenmarkDominican RepublicEarly-demographic dividendEast Asia & PacificEast Asia & Pacific (excluding high income)East Asia & Pacific (IDA & IBRD countries)EcuadorEgypt, Arab Rep.El SalvadorEquatorial GuineaEritreaEstoniaEuro areaEurope & Central AsiaEurope & Central Asia (excluding high income)Europe & Central Asia (IDA & IBRD countries)European UnionFinlandFranceGabonGambia, TheGermanyGhanaGreeceGuatemalaGuineaGuinea-BissauHaitiHeavily indebted poor countries (HIPC)High incomeHondurasHong Kong SAR, ChinaHungaryIBRD onlyIcelandIDA & IBRD totalIDA blendIDA onlyIDA totalIndiaIndonesiaIran, Islamic Rep.IrelandIsraelItalyJamaicaJapanJordanKazakhstanKenyaKorea, Rep.KosovoKuwaitKyrgyz RepublicLate-demographic dividendLatin America & Caribbean Latin America & Caribbean (excluding high income)Latin America & the Caribbean (IDA & IBRD countries)LatviaLeast developed countries: UN classificationLebanonLiberiaLithuaniaLow & middle incomeLow incomeLower middle incomeLuxembourgMacao SAR, ChinaMacedonia, FYRMadagascarMalawiMalaysiaMaliMaltaMauritaniaMauritiusMexicoMiddle East & North AfricaMiddle East & North Africa (excluding high income)Middle East & North Africa (IDA & IBRD countries)Middle incomeMoldovaMongoliaMontenegroMoroccoMozambiqueNamibiaNepalNetherlandsNew ZealandNicaraguaNigerNigeriaNorth AmericaNorwayOECD membersOmanOther small statesPakistanPanamaParaguayPeruPhilippinesPolandPortugalPost-demographic dividendPre-demographic dividendPuerto RicoQatarRomaniaRussian FederationRwandaSaudi ArabiaSenegalSerbiaSierra LeoneSingaporeSlovak RepublicSloveniaSmall statesSouth AfricaSouth AsiaSouth Asia (IDA & IBRD)South SudanSpainSri LankaSub-Saharan Africa Sub-Saharan Africa (excluding high income)Sub-Saharan Africa (IDA & IBRD countries)SudanSurinameSwazilandSwedenSwitzerlandTajikistanTanzaniaThailandTimor-LesteTogoTrinidad and TobagoTunisiaTurkeyUgandaUkraineUnited Arab EmiratesUnited KingdomUnited StatesUpper middle incomeUruguayVanuatuVenezuela, RBVietnamWest Bank and GazaWorldZimbabwe Timeline:
This timeline shows a graph from 1962 to 2016 of South Asia (IDA & IBRD). No data until 1961. Number of actual observations by date: 55.
Source name:
World Development Indicators
Source organization:
World Bank national accounts data, and OECD National Accounts data files.
Categories, topics:
Economy & Growth
Last updated:
apr 23, 2017
Indicators value changes by year
Minimum:
-3.672
jan 1, 1980
At the date of observation
Value
Absolute change
Change from previous value
jan 1, 1962
0.843
+0.843
0.0%
jan 1, 1963
-1.287
-2.13
-252.62%
jan 1, 1964
1.525
+2.811
-218.51%
jan 1, 1965
4.616
+3.092
202.77%
jan 1, 1966
-2.048
-6.664
-144.36%
jan 1, 1967
-0.626
+1.422
-69.44%
jan 1, 1968
1.818
+2.444
-390.63%
jan 1, 1969
0.634
-1.185
-65.16%
jan 1, 1970
1.62
+0.986
155.64%
jan 1, 1971
1.995
+0.375
23.15%
jan 1, 1972
-1.643
-3.637
-182.34%
jan 1, 1973
-3.205
-1.562
95.11%
jan 1, 1974
-2.861
+0.343
-10.71%
jan 1, 1975
-3.174
-0.313
10.94%
jan 1, 1976
1.536
+4.71
-148.39%
jan 1, 1977
-0.729
-2.265
-147.43%
jan 1, 1978
2.659
+3.387
-464.95%
jan 1, 1979
4.776
+2.117
79.63%
jan 1, 1980
-3.672
-8.448
-176.89%
jan 1, 1981
5.728
+9.4
-255.98%
jan 1, 1982
1.908
-3.82
-66.7%
jan 1, 1983
-1.77
-3.678
-192.81%
jan 1, 1984
4.526
+6.297
-355.66%
jan 1, 1985
1.323
-3.203
-70.76%
jan 1, 1986
1.566
+0.242
18.3%
jan 1, 1987
0.565
-1.001
-63.91%
jan 1, 1988
1.057
+0.491
86.96%
jan 1, 1989
4.041
+2.984
282.46%
jan 1, 1990
1.658
-2.382
-58.96%
jan 1, 1991
2.119
+0.461
27.79%
jan 1, 1992
-0.642
-2.761
-130.28%
jan 1, 1993
2.117
+2.759
-429.97%
jan 1, 1994
1.843
-0.275
-12.97%
jan 1, 1995
2.442
+0.599
32.51%
jan 1, 1996
3.843
+1.401
57.37%
jan 1, 1997
4.514
+0.671
17.47%
jan 1, 1998
1.147
-3.367
-74.6%
jan 1, 1999
3.339
+2.192
191.21%
jan 1, 2000
4.146
+0.807
24.17%
jan 1, 2001
1.198
-2.948
-71.11%
jan 1, 2002
2.906
+1.708
142.57%
jan 1, 2003
0.902
-2.004
-68.98%
jan 1, 2004
3.248
+2.347
260.33%
jan 1, 2005
4.019
+0.77
23.71%
jan 1, 2006
6.891
+2.873
71.48%
jan 1, 2007
5.635
-1.256
-18.23%
jan 1, 2008
3.835
-1.8
-31.95%
jan 1, 2009
4.792
+0.958
24.97%
jan 1, 2010
4.139
-0.653
-13.63%
jan 1, 2011
6.049
+1.91
46.15%
jan 1, 2012
6.927
+0.877
14.5%
jan 1, 2013
3.724
-3.202
-46.23%
jan 1, 2014
4.702
+0.977
26.24%
jan 1, 2015
4.54
-0.162
-3.45%
jan 1, 2016
5.384
+0.844
18.6%
Ranking of countries by current statistics by years


Comments: