29
/
en
AIzaSyAYiBZKx7MnpbEhh9jyipgxe19OcubqV5w
April 1, 2024
126279
El Salvador
SLV
true
2
1
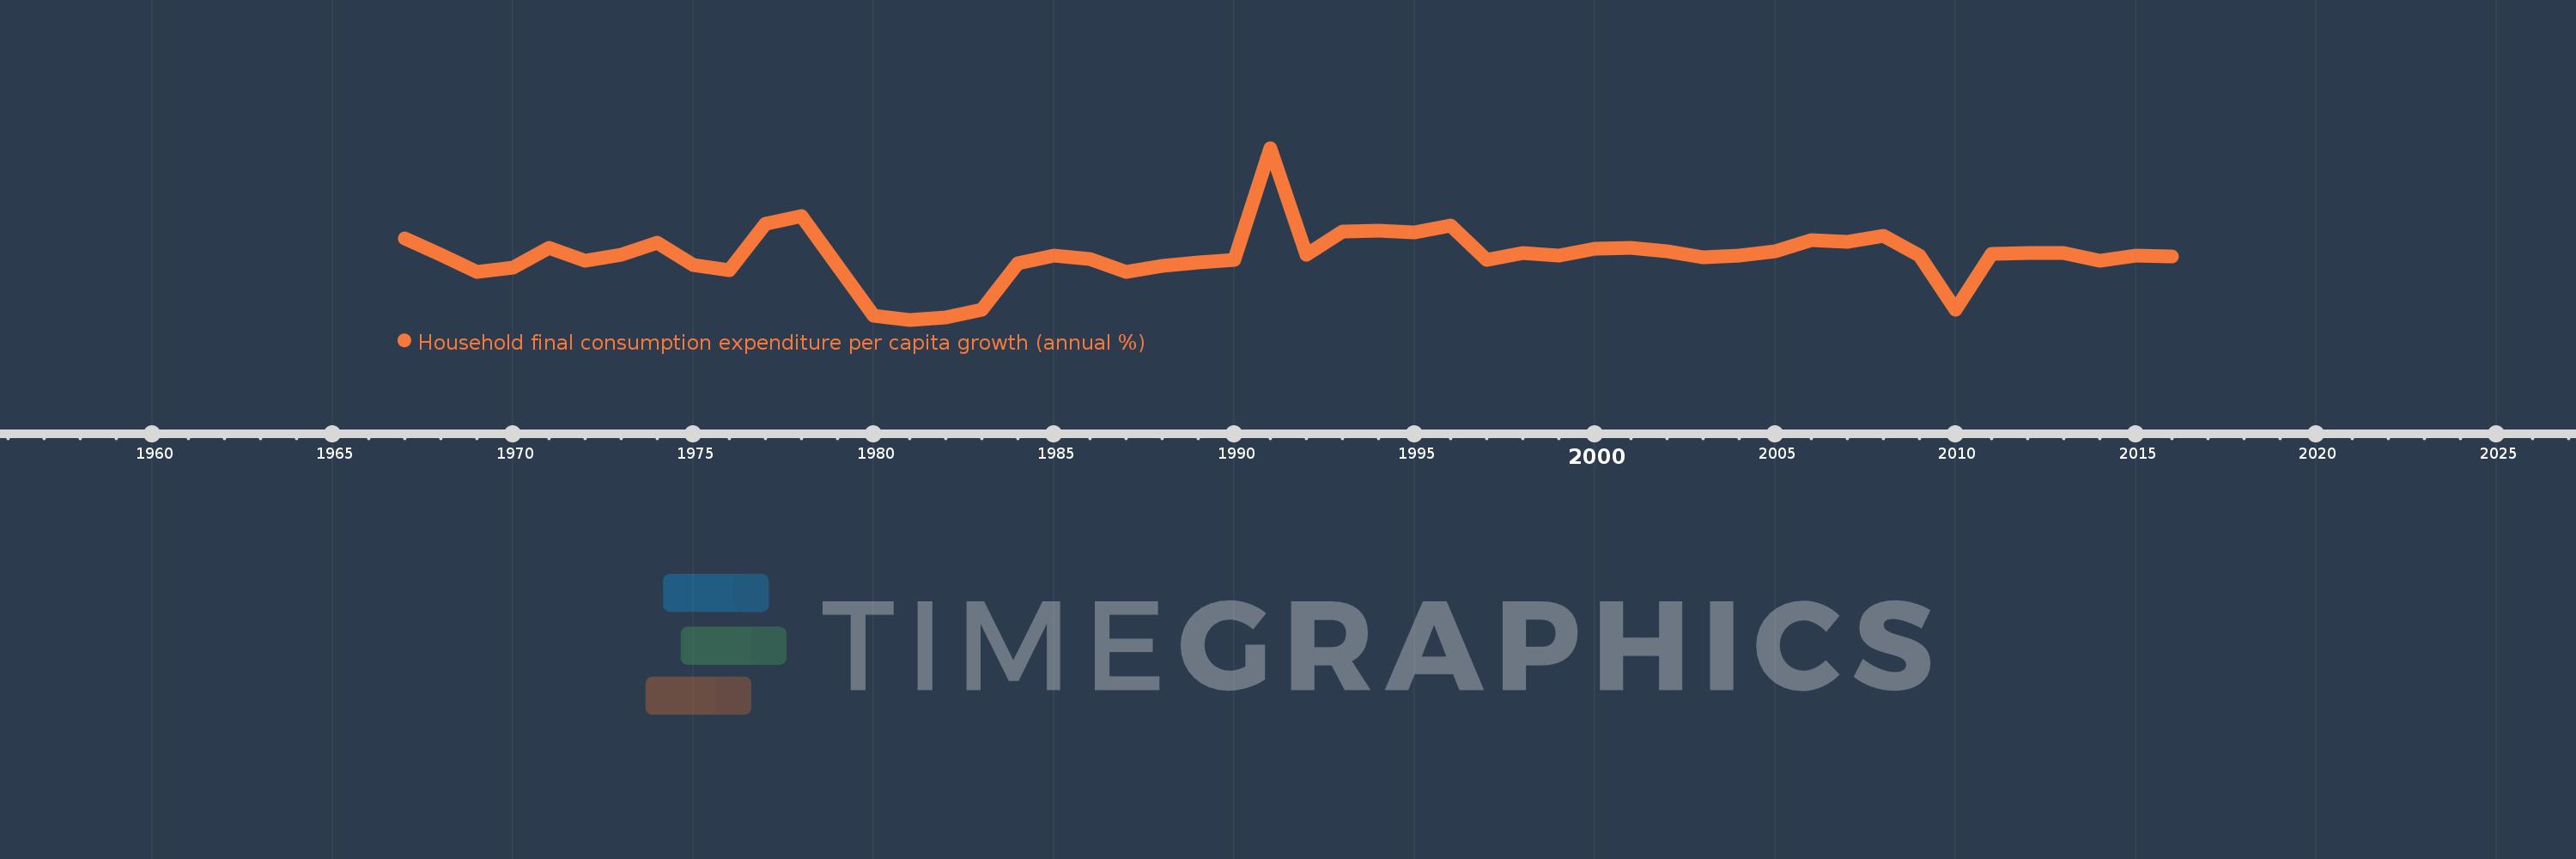
Household final consumption expenditure per capita growth (annual %)
2016,2015,2014,2013,2012,2011,2010,2009,2008,2007,2006,2005,2004,2003,2002,2001,2000,1999,1998,1997,1996,1995,1994,1993,1992,1991,1990,1989,1988,1987,1986,1985,1984,1983,1982,1981,1980,1979,1978,1977,1976,1975,1974,1973,1972,1971,1970,1969,1968,1967
This statistics in other country:
AlbaniaAlgeriaAntigua and BarbudaArab WorldArgentinaArmeniaAustraliaAustriaAzerbaijanBahamas, TheBahrainBangladeshBarbadosBelarusBelgiumBelizeBeninBhutanBoliviaBosnia and HerzegovinaBotswanaBrazilBrunei DarussalamBulgariaBurkina FasoBurundiCabo VerdeCambodiaCameroonCanadaCaribbean small statesCentral Europe and the BalticsChadChileChinaColombiaComorosCongo, Dem. Rep.Congo, Rep.Costa RicaCote d'IvoireCroatiaCubaCyprusCzech RepublicDenmarkDominican RepublicEarly-demographic dividendEast Asia & PacificEast Asia & Pacific (excluding high income)East Asia & Pacific (IDA & IBRD countries)EcuadorEgypt, Arab Rep.El SalvadorEquatorial GuineaEritreaEstoniaEuro areaEurope & Central AsiaEurope & Central Asia (excluding high income)Europe & Central Asia (IDA & IBRD countries)European UnionFinlandFranceGabonGambia, TheGermanyGhanaGreeceGuatemalaGuineaGuinea-BissauHaitiHeavily indebted poor countries (HIPC)High incomeHondurasHong Kong SAR, ChinaHungaryIBRD onlyIcelandIDA & IBRD totalIDA blendIDA onlyIDA totalIndiaIndonesiaIran, Islamic Rep.IrelandIsraelItalyJamaicaJapanJordanKazakhstanKenyaKorea, Rep.KosovoKuwaitKyrgyz RepublicLate-demographic dividendLatin America & Caribbean Latin America & Caribbean (excluding high income)Latin America & the Caribbean (IDA & IBRD countries)LatviaLeast developed countries: UN classificationLebanonLiberiaLithuaniaLow & middle incomeLow incomeLower middle incomeLuxembourgMacao SAR, ChinaMacedonia, FYRMadagascarMalawiMalaysiaMaliMaltaMauritaniaMauritiusMexicoMiddle East & North AfricaMiddle East & North Africa (excluding high income)Middle East & North Africa (IDA & IBRD countries)Middle incomeMoldovaMongoliaMontenegroMoroccoMozambiqueNamibiaNepalNetherlandsNew ZealandNicaraguaNigerNigeriaNorth AmericaNorwayOECD membersOmanOther small statesPakistanPanamaParaguayPeruPhilippinesPolandPortugalPost-demographic dividendPre-demographic dividendPuerto RicoQatarRomaniaRussian FederationRwandaSaudi ArabiaSenegalSerbiaSierra LeoneSingaporeSlovak RepublicSloveniaSmall statesSouth AfricaSouth AsiaSouth Asia (IDA & IBRD)South SudanSpainSri LankaSub-Saharan Africa Sub-Saharan Africa (excluding high income)Sub-Saharan Africa (IDA & IBRD countries)SudanSurinameSwazilandSwedenSwitzerlandTajikistanTanzaniaThailandTimor-LesteTogoTrinidad and TobagoTunisiaTurkeyUgandaUkraineUnited Arab EmiratesUnited KingdomUnited StatesUpper middle incomeUruguayVanuatuVenezuela, RBVietnamWest Bank and GazaWorldZimbabwe Timeline:
This timeline shows a graph from 1967 to 2016 of El Salvador. No data until 1966. Number of actual observations by date: 50.
Source name:
World Development Indicators
Source organization:
World Bank national accounts data, and OECD National Accounts data files.
Categories, topics:
Economy & Growth
Last updated:
apr 23, 2017
Indicators value changes by year
Minimum:
-12.699
jan 1, 1981
Maximum:
25.427
jan 1, 1991
At the date of observation
Value
Absolute change
Change from previous value
jan 1, 1967
5.434
+5.434
0.0%
jan 1, 1968
1.798
-3.635
-66.9%
jan 1, 1969
-2.106
-3.904
-217.11%
jan 1, 1970
-1.195
+0.911
-43.26%
jan 1, 1971
3.214
+4.409
-368.94%
jan 1, 1972
0.436
-2.778
-86.44%
jan 1, 1973
1.739
+1.303
299.2%
jan 1, 1974
4.464
+2.725
156.67%
jan 1, 1975
-0.481
-4.945
-110.79%
jan 1, 1976
-1.675
-1.193
247.8%
jan 1, 1977
8.683
+10.357
-618.5%
jan 1, 1978
10.26
+1.577
18.16%
jan 1, 1979
-0.778
-11.038
-107.59%
jan 1, 1980
-11.753
-10.975
1.41K%
jan 1, 1981
-12.699
-0.946
8.04%
jan 1, 1982
-12.279
+0.42
-3.31%
jan 1, 1983
-10.544
+1.734
-14.12%
jan 1, 1984
-0.154
+10.39
-98.54%
jan 1, 1985
1.456
+1.61
-1.04K%
jan 1, 1986
0.72
-0.736
-50.53%
jan 1, 1987
-1.998
-2.718
-377.36%
jan 1, 1988
-0.834
+1.163
-58.24%
jan 1, 1989
0.06
+0.894
-107.21%
jan 1, 1990
0.595
+0.535
890.2%
jan 1, 1991
25.427
+24.832
4.17K%
jan 1, 1992
1.698
-23.729
-93.32%
jan 1, 1993
6.876
+5.178
304.91%
jan 1, 1994
7.01
+0.134
1.95%
jan 1, 1995
6.662
-0.348
-4.96%
jan 1, 1996
8.132
+1.471
22.08%
jan 1, 1997
0.546
-7.587
-93.29%
jan 1, 1998
2.144
+1.599
293.01%
jan 1, 1999
1.601
-0.543
-25.34%
jan 1, 2000
2.997
+1.396
87.22%
jan 1, 2001
3.271
+0.274
9.15%
jan 1, 2002
2.545
-0.726
-22.18%
jan 1, 2003
1.095
-1.45
-56.97%
jan 1, 2004
1.594
+0.499
45.57%
jan 1, 2005
2.478
+0.884
55.44%
jan 1, 2006
4.914
+2.436
98.28%
jan 1, 2007
4.603
-0.311
-6.33%
jan 1, 2008
5.97
+1.367
29.7%
jan 1, 2009
1.522
-4.448
-74.5%
jan 1, 2010
-10.525
-12.047
-791.45%
jan 1, 2011
1.945
+12.47
-118.48%
jan 1, 2012
2.099
+0.154
7.9%
jan 1, 2013
2.108
+0.009
0.42%
jan 1, 2014
0.452
-1.655
-78.54%
jan 1, 2015
1.478
+1.025
226.72%
jan 1, 2016
1.413
-0.064
-4.35%
Ranking of countries by current statistics by years


Comments: