29
/
en
AIzaSyAYiBZKx7MnpbEhh9jyipgxe19OcubqV5w
April 1, 2024
203021
Mozambique
MOZ
true
2
1
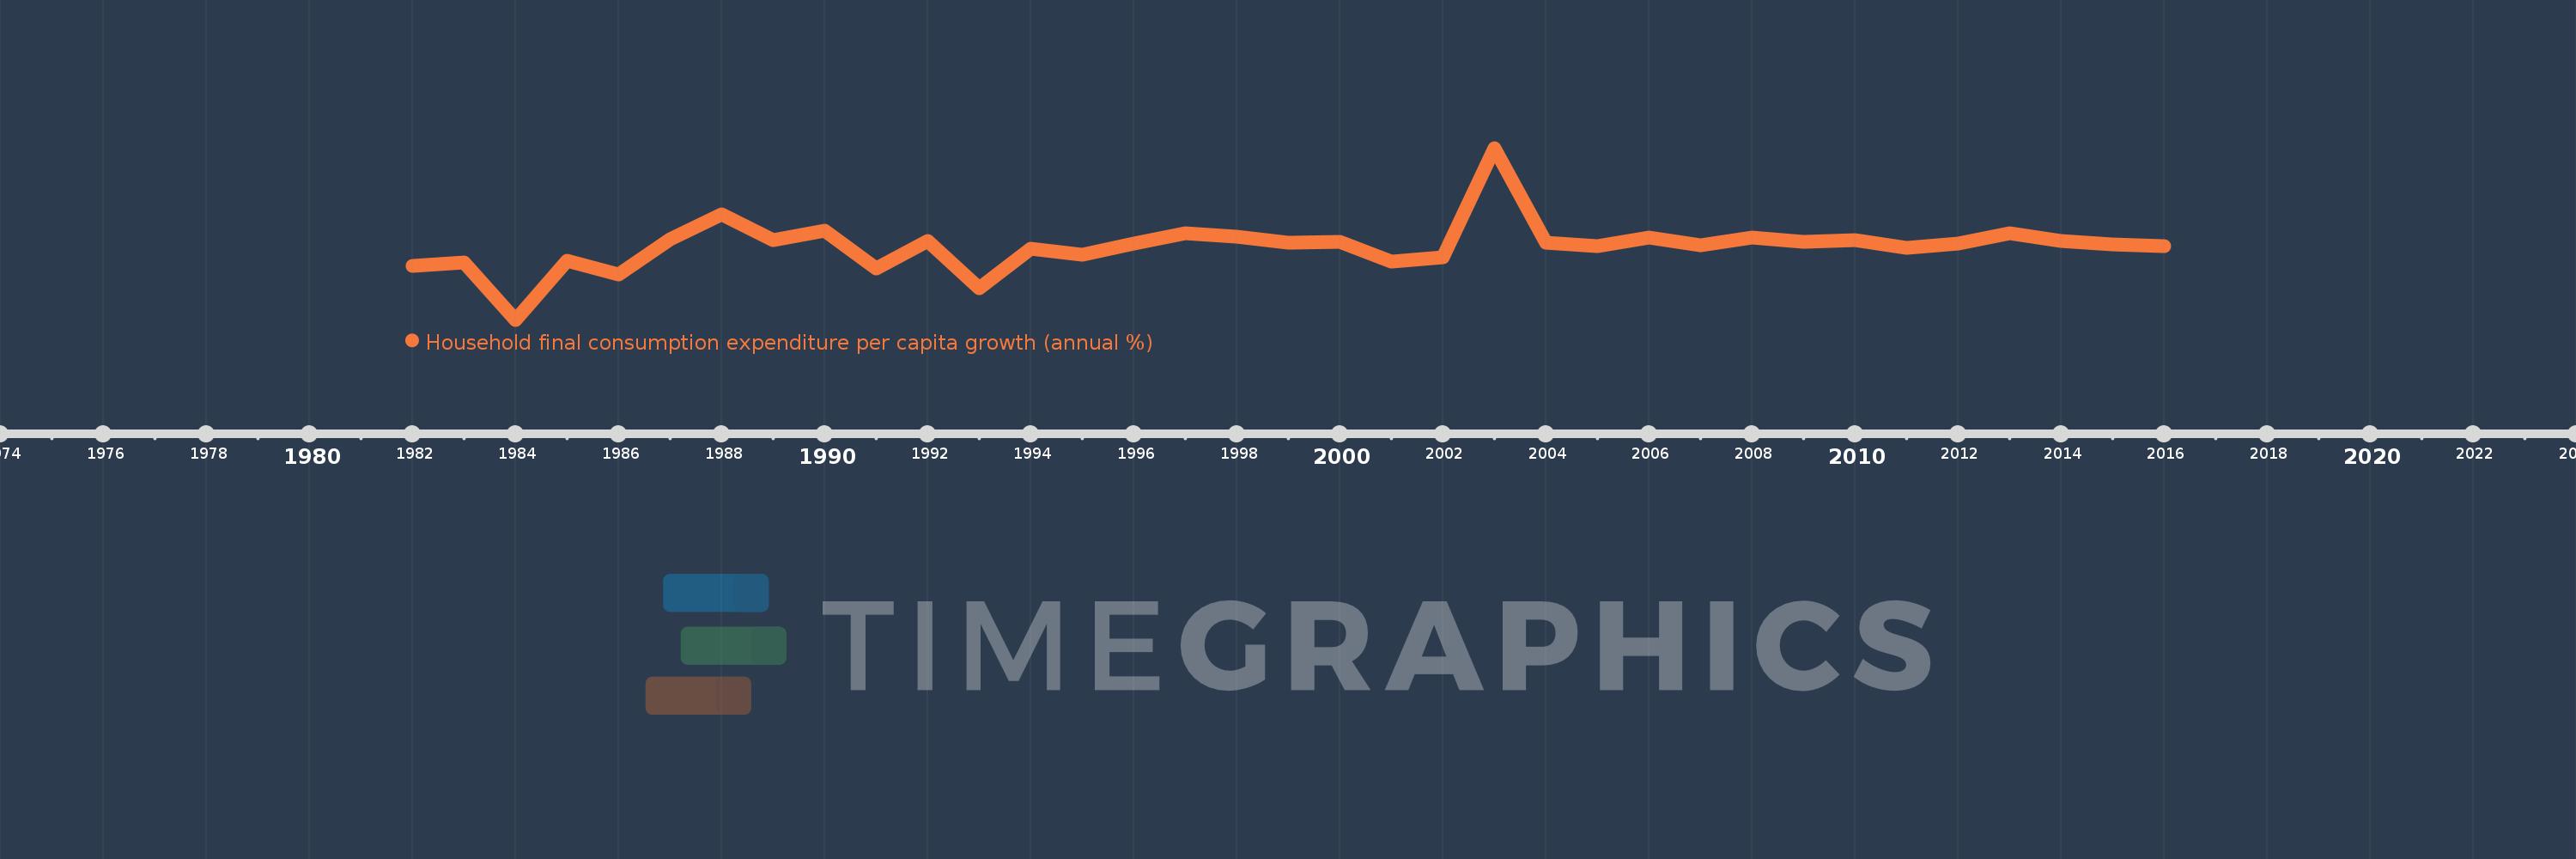
Household final consumption expenditure per capita growth (annual %)
2016,2015,2014,2013,2012,2011,2010,2009,2008,2007,2006,2005,2004,2003,2002,2001,2000,1999,1998,1997,1996,1995,1994,1993,1992,1991,1990,1989,1988,1987,1986,1985,1984,1983,1982
This statistics in other country:
AlbaniaAlgeriaAntigua and BarbudaArab WorldArgentinaArmeniaAustraliaAustriaAzerbaijanBahamas, TheBahrainBangladeshBarbadosBelarusBelgiumBelizeBeninBhutanBoliviaBosnia and HerzegovinaBotswanaBrazilBrunei DarussalamBulgariaBurkina FasoBurundiCabo VerdeCambodiaCameroonCanadaCaribbean small statesCentral Europe and the BalticsChadChileChinaColombiaComorosCongo, Dem. Rep.Congo, Rep.Costa RicaCote d'IvoireCroatiaCubaCyprusCzech RepublicDenmarkDominican RepublicEarly-demographic dividendEast Asia & PacificEast Asia & Pacific (excluding high income)East Asia & Pacific (IDA & IBRD countries)EcuadorEgypt, Arab Rep.El SalvadorEquatorial GuineaEritreaEstoniaEuro areaEurope & Central AsiaEurope & Central Asia (excluding high income)Europe & Central Asia (IDA & IBRD countries)European UnionFinlandFranceGabonGambia, TheGermanyGhanaGreeceGuatemalaGuineaGuinea-BissauHaitiHeavily indebted poor countries (HIPC)High incomeHondurasHong Kong SAR, ChinaHungaryIBRD onlyIcelandIDA & IBRD totalIDA blendIDA onlyIDA totalIndiaIndonesiaIran, Islamic Rep.IrelandIsraelItalyJamaicaJapanJordanKazakhstanKenyaKorea, Rep.KosovoKuwaitKyrgyz RepublicLate-demographic dividendLatin America & Caribbean Latin America & Caribbean (excluding high income)Latin America & the Caribbean (IDA & IBRD countries)LatviaLeast developed countries: UN classificationLebanonLiberiaLithuaniaLow & middle incomeLow incomeLower middle incomeLuxembourgMacao SAR, ChinaMacedonia, FYRMadagascarMalawiMalaysiaMaliMaltaMauritaniaMauritiusMexicoMiddle East & North AfricaMiddle East & North Africa (excluding high income)Middle East & North Africa (IDA & IBRD countries)Middle incomeMoldovaMongoliaMontenegroMoroccoMozambiqueNamibiaNepalNetherlandsNew ZealandNicaraguaNigerNigeriaNorth AmericaNorwayOECD membersOmanOther small statesPakistanPanamaParaguayPeruPhilippinesPolandPortugalPost-demographic dividendPre-demographic dividendPuerto RicoQatarRomaniaRussian FederationRwandaSaudi ArabiaSenegalSerbiaSierra LeoneSingaporeSlovak RepublicSloveniaSmall statesSouth AfricaSouth AsiaSouth Asia (IDA & IBRD)South SudanSpainSri LankaSub-Saharan Africa Sub-Saharan Africa (excluding high income)Sub-Saharan Africa (IDA & IBRD countries)SudanSurinameSwazilandSwedenSwitzerlandTajikistanTanzaniaThailandTimor-LesteTogoTrinidad and TobagoTunisiaTurkeyUgandaUkraineUnited Arab EmiratesUnited KingdomUnited StatesUpper middle incomeUruguayVanuatuVenezuela, RBVietnamWest Bank and GazaWorldZimbabwe Timeline:
This timeline shows a graph from 1982 to 2016 of Mozambique. No data until 1981. Number of actual observations by date: 35.
Source name:
World Development Indicators
Source organization:
World Bank national accounts data, and OECD National Accounts data files.
Categories, topics:
Economy & Growth
Last updated:
apr 23, 2017
Indicators value changes by year
Minimum:
-20.911
jan 1, 1984
Maximum:
30.977
jan 1, 2003
At the date of observation
Value
Absolute change
Change from previous value
jan 1, 1982
-4.567
-4.567
0.0%
jan 1, 1983
-3.519
+1.048
-22.96%
jan 1, 1984
-20.911
-17.392
494.27%
jan 1, 1985
-3.01
+17.901
-85.61%
jan 1, 1986
-7.262
-4.252
141.28%
jan 1, 1987
3.331
+10.593
-145.87%
jan 1, 1988
11.051
+7.72
231.77%
jan 1, 1989
3.132
-7.919
-71.66%
jan 1, 1990
6.034
+2.902
92.65%
jan 1, 1991
-5.358
-11.392
-188.79%
jan 1, 1992
2.954
+8.311
-155.13%
jan 1, 1993
-11.355
-14.309
-484.45%
jan 1, 1994
0.472
+11.827
-104.16%
jan 1, 1995
-1.221
-1.693
-358.79%
jan 1, 1996
2.051
+3.272
-267.94%
jan 1, 1997
5.246
+3.195
155.77%
jan 1, 1998
4.145
-1.101
-20.98%
jan 1, 1999
2.454
-1.691
-40.79%
jan 1, 2000
2.738
+0.283
11.54%
jan 1, 2001
-3.402
-6.14
-224.29%
jan 1, 2002
-2.08
+1.322
-38.86%
jan 1, 2003
30.977
+33.057
-1.59K%
jan 1, 2004
2.372
-28.605
-92.34%
jan 1, 2005
1.246
-1.126
-47.46%
jan 1, 2006
3.917
+2.67
214.24%
jan 1, 2007
1.558
-2.359
-60.22%
jan 1, 2008
3.88
+2.323
149.08%
jan 1, 2009
2.545
-1.336
-34.42%
jan 1, 2010
3.241
+0.697
27.37%
jan 1, 2011
0.744
-2.498
-77.06%
jan 1, 2012
2.029
+1.285
172.79%
jan 1, 2013
5.147
+3.118
153.68%
jan 1, 2014
2.952
-2.195
-42.65%
jan 1, 2015
1.805
-1.146
-38.83%
jan 1, 2016
1.313
-0.492
-27.24%
Ranking of countries by current statistics by years


Comments: