29
/
en
AIzaSyAYiBZKx7MnpbEhh9jyipgxe19OcubqV5w
April 1, 2024
222285
Peru
PER
true
2
1
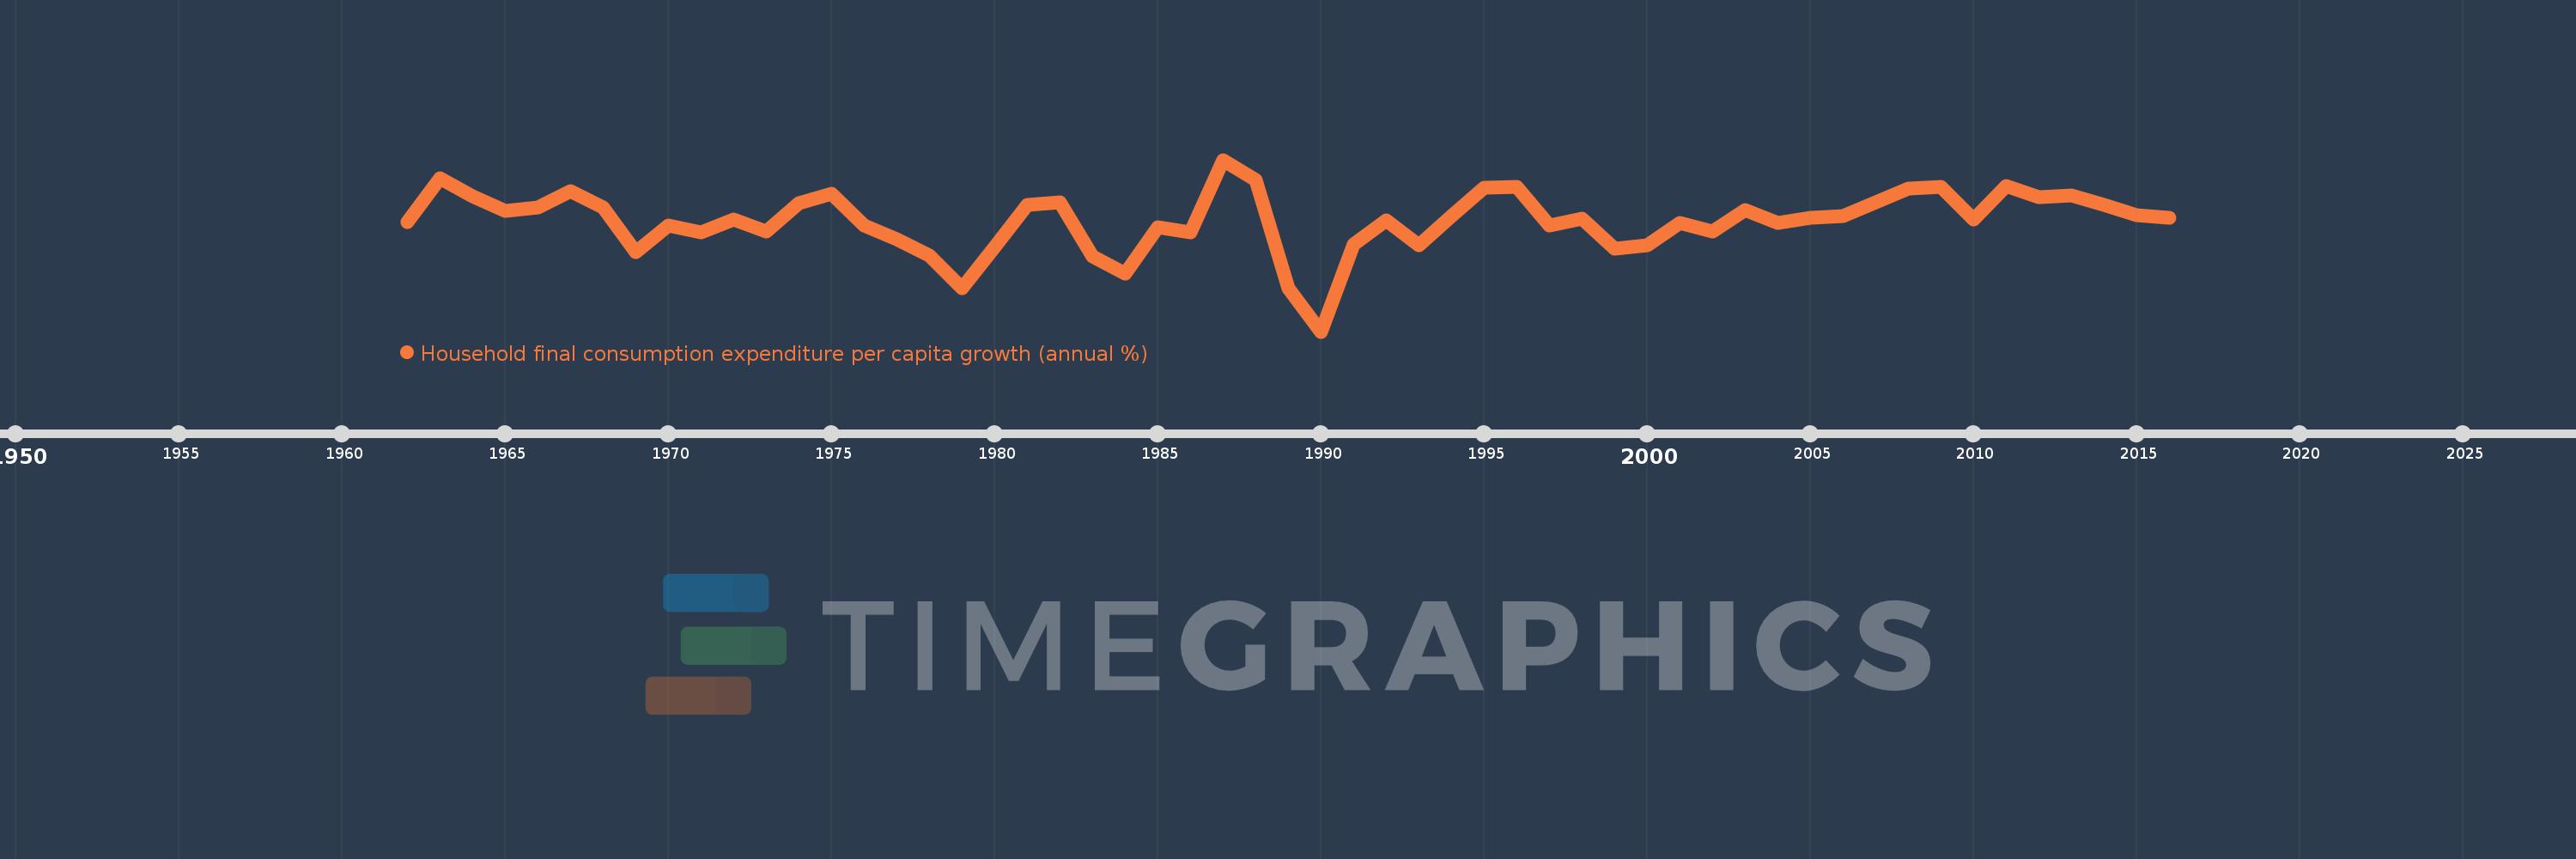
Household final consumption expenditure per capita growth (annual %)
2016,2015,2014,2013,2012,2011,2010,2009,2008,2007,2006,2005,2004,2003,2002,2001,2000,1999,1998,1997,1996,1995,1994,1993,1992,1991,1990,1989,1988,1987,1986,1985,1984,1983,1982,1981,1980,1979,1978,1977,1976,1975,1974,1973,1972,1971,1970,1969,1968,1967,1966,1965,1964,1963,1962
This statistics in other country:
AlbaniaAlgeriaAntigua and BarbudaArab WorldArgentinaArmeniaAustraliaAustriaAzerbaijanBahamas, TheBahrainBangladeshBarbadosBelarusBelgiumBelizeBeninBhutanBoliviaBosnia and HerzegovinaBotswanaBrazilBrunei DarussalamBulgariaBurkina FasoBurundiCabo VerdeCambodiaCameroonCanadaCaribbean small statesCentral Europe and the BalticsChadChileChinaColombiaComorosCongo, Dem. Rep.Congo, Rep.Costa RicaCote d'IvoireCroatiaCubaCyprusCzech RepublicDenmarkDominican RepublicEarly-demographic dividendEast Asia & PacificEast Asia & Pacific (excluding high income)East Asia & Pacific (IDA & IBRD countries)EcuadorEgypt, Arab Rep.El SalvadorEquatorial GuineaEritreaEstoniaEuro areaEurope & Central AsiaEurope & Central Asia (excluding high income)Europe & Central Asia (IDA & IBRD countries)European UnionFinlandFranceGabonGambia, TheGermanyGhanaGreeceGuatemalaGuineaGuinea-BissauHaitiHeavily indebted poor countries (HIPC)High incomeHondurasHong Kong SAR, ChinaHungaryIBRD onlyIcelandIDA & IBRD totalIDA blendIDA onlyIDA totalIndiaIndonesiaIran, Islamic Rep.IrelandIsraelItalyJamaicaJapanJordanKazakhstanKenyaKorea, Rep.KosovoKuwaitKyrgyz RepublicLate-demographic dividendLatin America & Caribbean Latin America & Caribbean (excluding high income)Latin America & the Caribbean (IDA & IBRD countries)LatviaLeast developed countries: UN classificationLebanonLiberiaLithuaniaLow & middle incomeLow incomeLower middle incomeLuxembourgMacao SAR, ChinaMacedonia, FYRMadagascarMalawiMalaysiaMaliMaltaMauritaniaMauritiusMexicoMiddle East & North AfricaMiddle East & North Africa (excluding high income)Middle East & North Africa (IDA & IBRD countries)Middle incomeMoldovaMongoliaMontenegroMoroccoMozambiqueNamibiaNepalNetherlandsNew ZealandNicaraguaNigerNigeriaNorth AmericaNorwayOECD membersOmanOther small statesPakistanPanamaParaguayPeruPhilippinesPolandPortugalPost-demographic dividendPre-demographic dividendPuerto RicoQatarRomaniaRussian FederationRwandaSaudi ArabiaSenegalSerbiaSierra LeoneSingaporeSlovak RepublicSloveniaSmall statesSouth AfricaSouth AsiaSouth Asia (IDA & IBRD)South SudanSpainSri LankaSub-Saharan Africa Sub-Saharan Africa (excluding high income)Sub-Saharan Africa (IDA & IBRD countries)SudanSurinameSwazilandSwedenSwitzerlandTajikistanTanzaniaThailandTimor-LesteTogoTrinidad and TobagoTunisiaTurkeyUgandaUkraineUnited Arab EmiratesUnited KingdomUnited StatesUpper middle incomeUruguayVanuatuVenezuela, RBVietnamWest Bank and GazaWorldZimbabwe Timeline:
This timeline shows a graph from 1962 to 2016 of Peru. No data until 1961. Number of actual observations by date: 55.
Source name:
World Development Indicators
Source organization:
World Bank national accounts data, and OECD National Accounts data files.
Categories, topics:
Economy & Growth
Last updated:
apr 23, 2017
Indicators value changes by year
Minimum:
-18.135
jan 1, 1990
Maximum:
12.414
jan 1, 1987
At the date of observation
Value
Absolute change
Change from previous value
jan 1, 1962
1.388
+1.388
0.0%
jan 1, 1963
9.111
+7.723
556.52%
jan 1, 1964
5.955
-3.156
-34.64%
jan 1, 1965
3.266
-2.689
-45.16%
jan 1, 1966
3.974
+0.708
21.68%
jan 1, 1967
6.854
+2.88
72.47%
jan 1, 1968
3.981
-2.872
-41.91%
jan 1, 1969
-3.994
-7.976
-200.33%
jan 1, 1970
0.678
+4.673
-116.99%
jan 1, 1971
-0.433
-1.111
-163.75%
jan 1, 1972
1.789
+2.222
-513.63%
jan 1, 1973
-0.403
-2.192
-122.54%
jan 1, 1974
4.697
+5.1
-1.26K%
jan 1, 1975
6.428
+1.731
36.85%
jan 1, 1976
0.737
-5.691
-88.54%
jan 1, 1977
-1.721
-2.458
-333.69%
jan 1, 1978
-4.632
-2.911
169.1%
jan 1, 1979
-10.483
-5.851
126.32%
jan 1, 1980
-3.131
+7.351
-70.13%
jan 1, 1981
4.371
+7.503
-239.6%
jan 1, 1982
4.855
+0.483
11.06%
jan 1, 1983
-4.733
-9.588
-197.5%
jan 1, 1984
-7.792
-3.059
64.64%
jan 1, 1985
0.394
+8.187
-105.06%
jan 1, 1986
-0.569
-0.964
-244.32%
jan 1, 1987
12.414
+12.983
-2.28K%
jan 1, 1988
8.823
-3.59
-28.92%
jan 1, 1989
-10.346
-19.169
-217.26%
jan 1, 1990
-18.135
-7.789
75.29%
jan 1, 1991
-2.635
+15.5
-85.47%
jan 1, 1992
1.592
+4.227
-160.42%
jan 1, 1993
-2.723
-4.315
-271.02%
jan 1, 1994
2.421
+5.144
-188.91%
jan 1, 1995
7.442
+5.021
207.4%
jan 1, 1996
7.606
+0.164
2.2%
jan 1, 1997
0.682
-6.924
-91.03%
jan 1, 1998
2.01
+1.328
194.68%
jan 1, 1999
-3.425
-5.435
-270.35%
jan 1, 2000
-2.828
+0.597
-17.42%
jan 1, 2001
1.125
+3.953
-139.78%
jan 1, 2002
-0.328
-1.453
-129.19%
jan 1, 2003
3.53
+3.859
-1.18K%
jan 1, 2004
1.234
-2.296
-65.04%
jan 1, 2005
2.125
+0.891
72.2%
jan 1, 2006
2.394
+0.269
12.66%
jan 1, 2007
4.921
+2.527
105.53%
jan 1, 2008
7.333
+2.412
49.0%
jan 1, 2009
7.57
+0.237
3.23%
jan 1, 2010
1.795
-5.775
-76.29%
jan 1, 2011
7.719
+5.924
330.03%
jan 1, 2012
5.81
-1.909
-24.73%
jan 1, 2013
6.014
+0.204
3.52%
jan 1, 2014
4.326
-1.689
-28.08%
jan 1, 2015
2.553
-1.773
-40.98%
jan 1, 2016
2.061
-0.492
-19.27%
Ranking of countries by current statistics by years


Comments: