29
/
en
AIzaSyAYiBZKx7MnpbEhh9jyipgxe19OcubqV5w
April 1, 2024
164940
Jordan
JOR
true
2
1
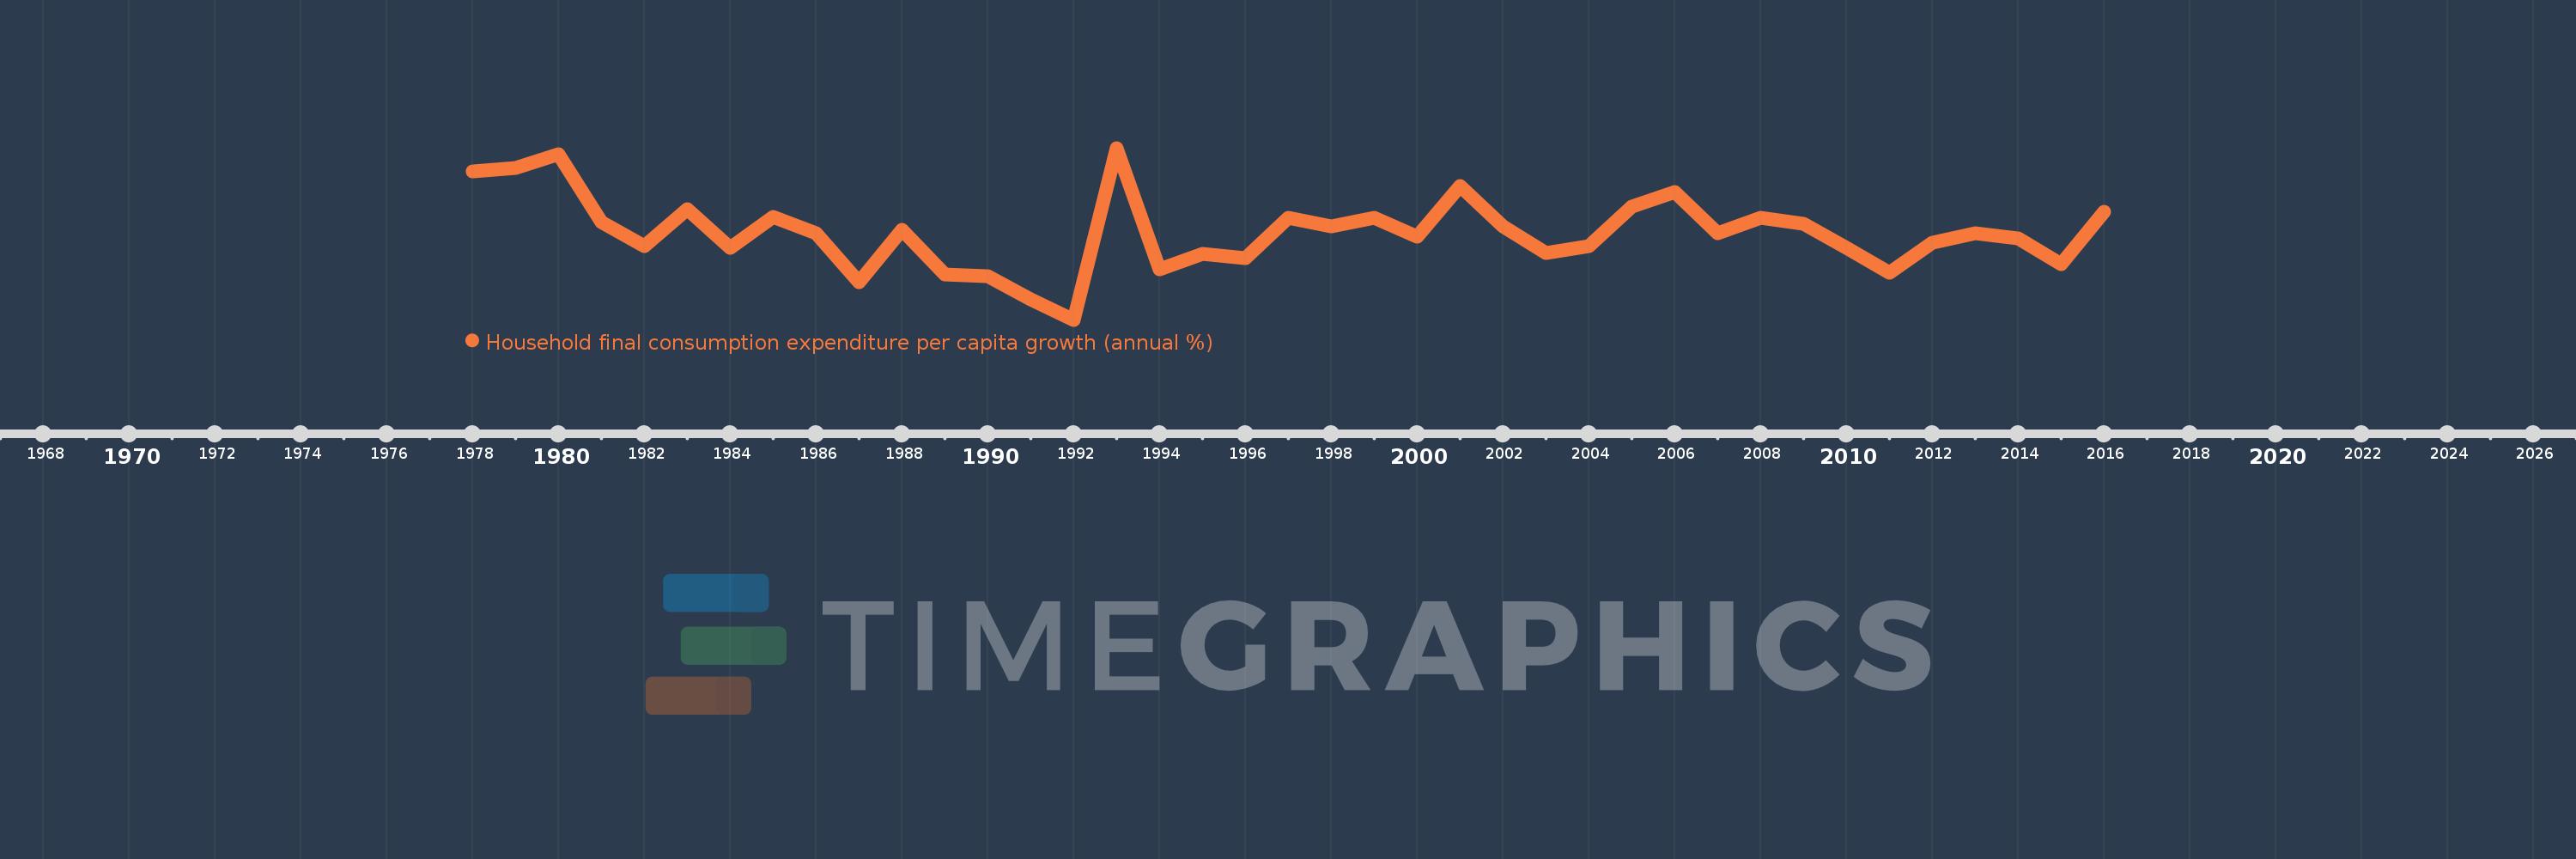
Household final consumption expenditure per capita growth (annual %)
2016,2015,2014,2013,2012,2011,2010,2009,2008,2007,2006,2005,2004,2003,2002,2001,2000,1999,1998,1997,1996,1995,1994,1993,1992,1991,1990,1989,1988,1987,1986,1985,1984,1983,1982,1981,1980,1979,1978
This statistics in other country:
AlbaniaAlgeriaAntigua and BarbudaArab WorldArgentinaArmeniaAustraliaAustriaAzerbaijanBahamas, TheBahrainBangladeshBarbadosBelarusBelgiumBelizeBeninBhutanBoliviaBosnia and HerzegovinaBotswanaBrazilBrunei DarussalamBulgariaBurkina FasoBurundiCabo VerdeCambodiaCameroonCanadaCaribbean small statesCentral Europe and the BalticsChadChileChinaColombiaComorosCongo, Dem. Rep.Congo, Rep.Costa RicaCote d'IvoireCroatiaCubaCyprusCzech RepublicDenmarkDominican RepublicEarly-demographic dividendEast Asia & PacificEast Asia & Pacific (excluding high income)East Asia & Pacific (IDA & IBRD countries)EcuadorEgypt, Arab Rep.El SalvadorEquatorial GuineaEritreaEstoniaEuro areaEurope & Central AsiaEurope & Central Asia (excluding high income)Europe & Central Asia (IDA & IBRD countries)European UnionFinlandFranceGabonGambia, TheGermanyGhanaGreeceGuatemalaGuineaGuinea-BissauHaitiHeavily indebted poor countries (HIPC)High incomeHondurasHong Kong SAR, ChinaHungaryIBRD onlyIcelandIDA & IBRD totalIDA blendIDA onlyIDA totalIndiaIndonesiaIran, Islamic Rep.IrelandIsraelItalyJamaicaJapanJordanKazakhstanKenyaKorea, Rep.KosovoKuwaitKyrgyz RepublicLate-demographic dividendLatin America & Caribbean Latin America & Caribbean (excluding high income)Latin America & the Caribbean (IDA & IBRD countries)LatviaLeast developed countries: UN classificationLebanonLiberiaLithuaniaLow & middle incomeLow incomeLower middle incomeLuxembourgMacao SAR, ChinaMacedonia, FYRMadagascarMalawiMalaysiaMaliMaltaMauritaniaMauritiusMexicoMiddle East & North AfricaMiddle East & North Africa (excluding high income)Middle East & North Africa (IDA & IBRD countries)Middle incomeMoldovaMongoliaMontenegroMoroccoMozambiqueNamibiaNepalNetherlandsNew ZealandNicaraguaNigerNigeriaNorth AmericaNorwayOECD membersOmanOther small statesPakistanPanamaParaguayPeruPhilippinesPolandPortugalPost-demographic dividendPre-demographic dividendPuerto RicoQatarRomaniaRussian FederationRwandaSaudi ArabiaSenegalSerbiaSierra LeoneSingaporeSlovak RepublicSloveniaSmall statesSouth AfricaSouth AsiaSouth Asia (IDA & IBRD)South SudanSpainSri LankaSub-Saharan Africa Sub-Saharan Africa (excluding high income)Sub-Saharan Africa (IDA & IBRD countries)SudanSurinameSwazilandSwedenSwitzerlandTajikistanTanzaniaThailandTimor-LesteTogoTrinidad and TobagoTunisiaTurkeyUgandaUkraineUnited Arab EmiratesUnited KingdomUnited StatesUpper middle incomeUruguayVanuatuVenezuela, RBVietnamWest Bank and GazaWorldZimbabwe Timeline:
This timeline shows a graph from 1978 to 2016 of Jordan. No data until 1977. Number of actual observations by date: 39.
Source name:
World Development Indicators
Source organization:
World Bank national accounts data, and OECD National Accounts data files.
Categories, topics:
Economy & Growth
Last updated:
apr 23, 2017
Indicators value changes by year
Minimum:
-17.817
jan 1, 1992
Maximum:
21.016
jan 1, 1993
At the date of observation
Value
Absolute change
Change from previous value
jan 1, 1978
15.712
+15.712
0.0%
jan 1, 1979
16.552
+0.841
5.35%
jan 1, 1980
19.643
+3.091
18.67%
jan 1, 1981
4.212
-15.431
-78.56%
jan 1, 1982
-1.122
-5.334
-126.63%
jan 1, 1983
7.172
+8.294
-739.48%
jan 1, 1984
-1.492
-8.664
-120.8%
jan 1, 1985
5.347
+6.839
-458.49%
jan 1, 1986
1.761
-3.586
-67.07%
jan 1, 1987
-9.344
-11.104
-630.64%
jan 1, 1988
2.419
+11.763
-125.89%
jan 1, 1989
-7.613
-10.032
-414.66%
jan 1, 1990
-8.012
-0.399
5.24%
jan 1, 1991
-13.249
-5.237
65.37%
jan 1, 1992
-17.817
-4.568
34.47%
jan 1, 1993
21.016
+38.833
-217.96%
jan 1, 1994
-6.467
-27.483
-130.77%
jan 1, 1995
-2.841
+3.625
-56.06%
jan 1, 1996
-3.915
-1.074
37.79%
jan 1, 1997
5.16
+9.076
-231.79%
jan 1, 1998
3.375
-1.785
-34.6%
jan 1, 1999
5.3
+1.926
57.06%
jan 1, 2000
1.0
-4.301
-81.14%
jan 1, 2001
12.434
+11.435
1.14K%
jan 1, 2002
3.359
-9.076
-72.99%
jan 1, 2003
-2.791
-6.149
-183.08%
jan 1, 2004
-1.148
+1.643
-58.88%
jan 1, 2005
7.816
+8.963
-781.07%
jan 1, 2006
11.055
+3.239
41.45%
jan 1, 2007
1.753
-9.302
-84.14%
jan 1, 2008
5.308
+3.554
202.74%
jan 1, 2009
3.835
-1.472
-27.74%
jan 1, 2010
-1.476
-5.311
-138.48%
jan 1, 2011
-7.284
-5.808
393.46%
jan 1, 2012
-0.384
+6.899
-94.73%
jan 1, 2013
1.765
+2.149
-559.44%
jan 1, 2014
0.531
-1.234
-69.94%
jan 1, 2015
-5.239
-5.769
-1.09K%
jan 1, 2016
6.567
+11.806
-225.37%
Ranking of countries by current statistics by years


Comments: