29
/
en
AIzaSyAYiBZKx7MnpbEhh9jyipgxe19OcubqV5w
April 1, 2024
247644
Spain
ESP
true
2
1
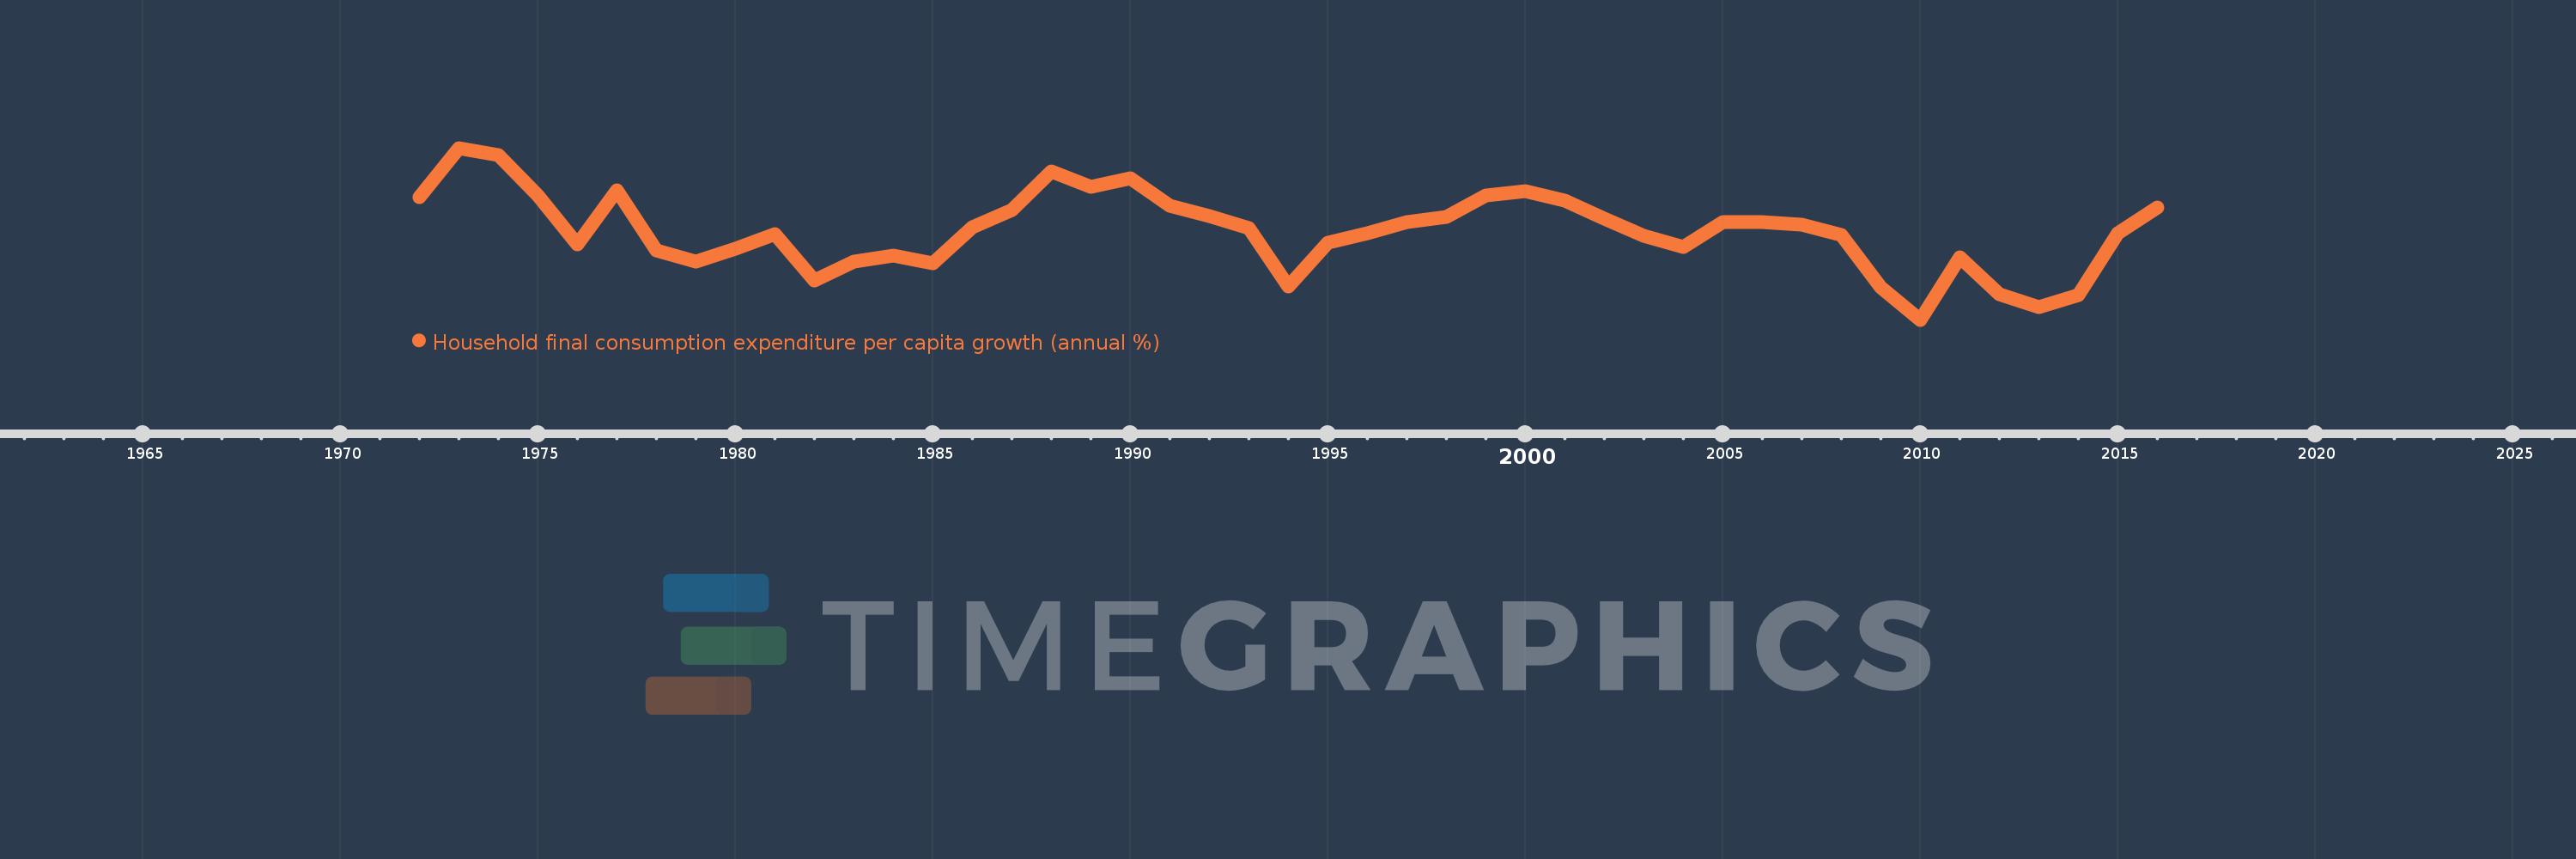
Household final consumption expenditure per capita growth (annual %)
2016,2015,2014,2013,2012,2011,2010,2009,2008,2007,2006,2005,2004,2003,2002,2001,2000,1999,1998,1997,1996,1995,1994,1993,1992,1991,1990,1989,1988,1987,1986,1985,1984,1983,1982,1981,1980,1979,1978,1977,1976,1975,1974,1973,1972
This statistics in other country:
AlbaniaAlgeriaAntigua and BarbudaArab WorldArgentinaArmeniaAustraliaAustriaAzerbaijanBahamas, TheBahrainBangladeshBarbadosBelarusBelgiumBelizeBeninBhutanBoliviaBosnia and HerzegovinaBotswanaBrazilBrunei DarussalamBulgariaBurkina FasoBurundiCabo VerdeCambodiaCameroonCanadaCaribbean small statesCentral Europe and the BalticsChadChileChinaColombiaComorosCongo, Dem. Rep.Congo, Rep.Costa RicaCote d'IvoireCroatiaCubaCyprusCzech RepublicDenmarkDominican RepublicEarly-demographic dividendEast Asia & PacificEast Asia & Pacific (excluding high income)East Asia & Pacific (IDA & IBRD countries)EcuadorEgypt, Arab Rep.El SalvadorEquatorial GuineaEritreaEstoniaEuro areaEurope & Central AsiaEurope & Central Asia (excluding high income)Europe & Central Asia (IDA & IBRD countries)European UnionFinlandFranceGabonGambia, TheGermanyGhanaGreeceGuatemalaGuineaGuinea-BissauHaitiHeavily indebted poor countries (HIPC)High incomeHondurasHong Kong SAR, ChinaHungaryIBRD onlyIcelandIDA & IBRD totalIDA blendIDA onlyIDA totalIndiaIndonesiaIran, Islamic Rep.IrelandIsraelItalyJamaicaJapanJordanKazakhstanKenyaKorea, Rep.KosovoKuwaitKyrgyz RepublicLate-demographic dividendLatin America & Caribbean Latin America & Caribbean (excluding high income)Latin America & the Caribbean (IDA & IBRD countries)LatviaLeast developed countries: UN classificationLebanonLiberiaLithuaniaLow & middle incomeLow incomeLower middle incomeLuxembourgMacao SAR, ChinaMacedonia, FYRMadagascarMalawiMalaysiaMaliMaltaMauritaniaMauritiusMexicoMiddle East & North AfricaMiddle East & North Africa (excluding high income)Middle East & North Africa (IDA & IBRD countries)Middle incomeMoldovaMongoliaMontenegroMoroccoMozambiqueNamibiaNepalNetherlandsNew ZealandNicaraguaNigerNigeriaNorth AmericaNorwayOECD membersOmanOther small statesPakistanPanamaParaguayPeruPhilippinesPolandPortugalPost-demographic dividendPre-demographic dividendPuerto RicoQatarRomaniaRussian FederationRwandaSaudi ArabiaSenegalSerbiaSierra LeoneSingaporeSlovak RepublicSloveniaSmall statesSouth AfricaSouth AsiaSouth Asia (IDA & IBRD)South SudanSpainSri LankaSub-Saharan Africa Sub-Saharan Africa (excluding high income)Sub-Saharan Africa (IDA & IBRD countries)SudanSurinameSwazilandSwedenSwitzerlandTajikistanTanzaniaThailandTimor-LesteTogoTrinidad and TobagoTunisiaTurkeyUgandaUkraineUnited Arab EmiratesUnited KingdomUnited StatesUpper middle incomeUruguayVanuatuVenezuela, RBVietnamWest Bank and GazaWorldZimbabwe Timeline:
This timeline shows a graph from 1972 to 2016 of Spain. No data until 1971. Number of actual observations by date: 45.
Source name:
World Development Indicators
Source organization:
World Bank national accounts data, and OECD National Accounts data files.
Categories, topics:
Economy & Growth
Last updated:
apr 23, 2017
Indicators value changes by year
Minimum:
-4.465
jan 1, 2010
At the date of observation
Value
Absolute change
Change from previous value
jan 1, 1972
3.941
+3.941
0.0%
jan 1, 1973
7.324
+3.382
85.82%
jan 1, 1974
6.826
-0.497
-6.79%
jan 1, 1975
4.091
-2.735
-40.06%
jan 1, 1976
0.722
-3.37
-82.36%
jan 1, 1977
4.399
+3.677
509.46%
jan 1, 1978
0.298
-4.101
-93.22%
jan 1, 1979
-0.475
-0.773
-259.17%
jan 1, 1980
0.405
+0.88
-185.32%
jan 1, 1981
1.417
+1.012
249.96%
jan 1, 1982
-1.79
-3.207
-226.31%
jan 1, 1983
-0.493
+1.297
-72.45%
jan 1, 1984
-0.084
+0.409
-82.93%
jan 1, 1985
-0.606
-0.522
620.2%
jan 1, 1986
1.91
+2.516
-415.08%
jan 1, 1987
3.089
+1.179
61.74%
jan 1, 1988
5.691
+2.602
84.22%
jan 1, 1989
4.661
-1.03
-18.1%
jan 1, 1990
5.221
+0.56
12.02%
jan 1, 1991
3.353
-1.868
-35.77%
jan 1, 1992
2.653
-0.701
-20.9%
jan 1, 1993
1.837
-0.816
-30.75%
jan 1, 1994
-2.207
-4.044
-220.15%
jan 1, 1995
0.813
+3.02
-136.83%
jan 1, 1996
1.476
+0.663
81.56%
jan 1, 1997
2.221
+0.745
50.48%
jan 1, 1998
2.589
+0.368
16.59%
jan 1, 1999
4.08
+1.491
57.58%
jan 1, 2000
4.347
+0.267
6.54%
jan 1, 2001
3.685
-0.662
-15.23%
jan 1, 2002
2.472
-1.213
-32.92%
jan 1, 2003
1.32
-1.152
-46.61%
jan 1, 2004
0.548
-0.772
-58.48%
jan 1, 2005
2.252
+1.704
310.99%
jan 1, 2006
2.258
+0.006
0.27%
jan 1, 2007
2.058
-0.2
-8.86%
jan 1, 2008
1.37
-0.688
-33.45%
jan 1, 2009
-2.226
-3.595
-262.51%
jan 1, 2010
-4.465
-2.239
100.62%
jan 1, 2011
-0.209
+4.256
-95.31%
jan 1, 2012
-2.7
-2.491
1.19K%
jan 1, 2013
-3.573
-0.873
32.34%
jan 1, 2014
-2.745
+0.829
-23.2%
jan 1, 2015
1.457
+4.201
-153.07%
jan 1, 2016
3.24
+1.783
122.44%
Ranking of countries by current statistics by years


Comments: