29
/
en
AIzaSyAYiBZKx7MnpbEhh9jyipgxe19OcubqV5w
April 1, 2024
209413
New Zealand
NZL
true
2
1
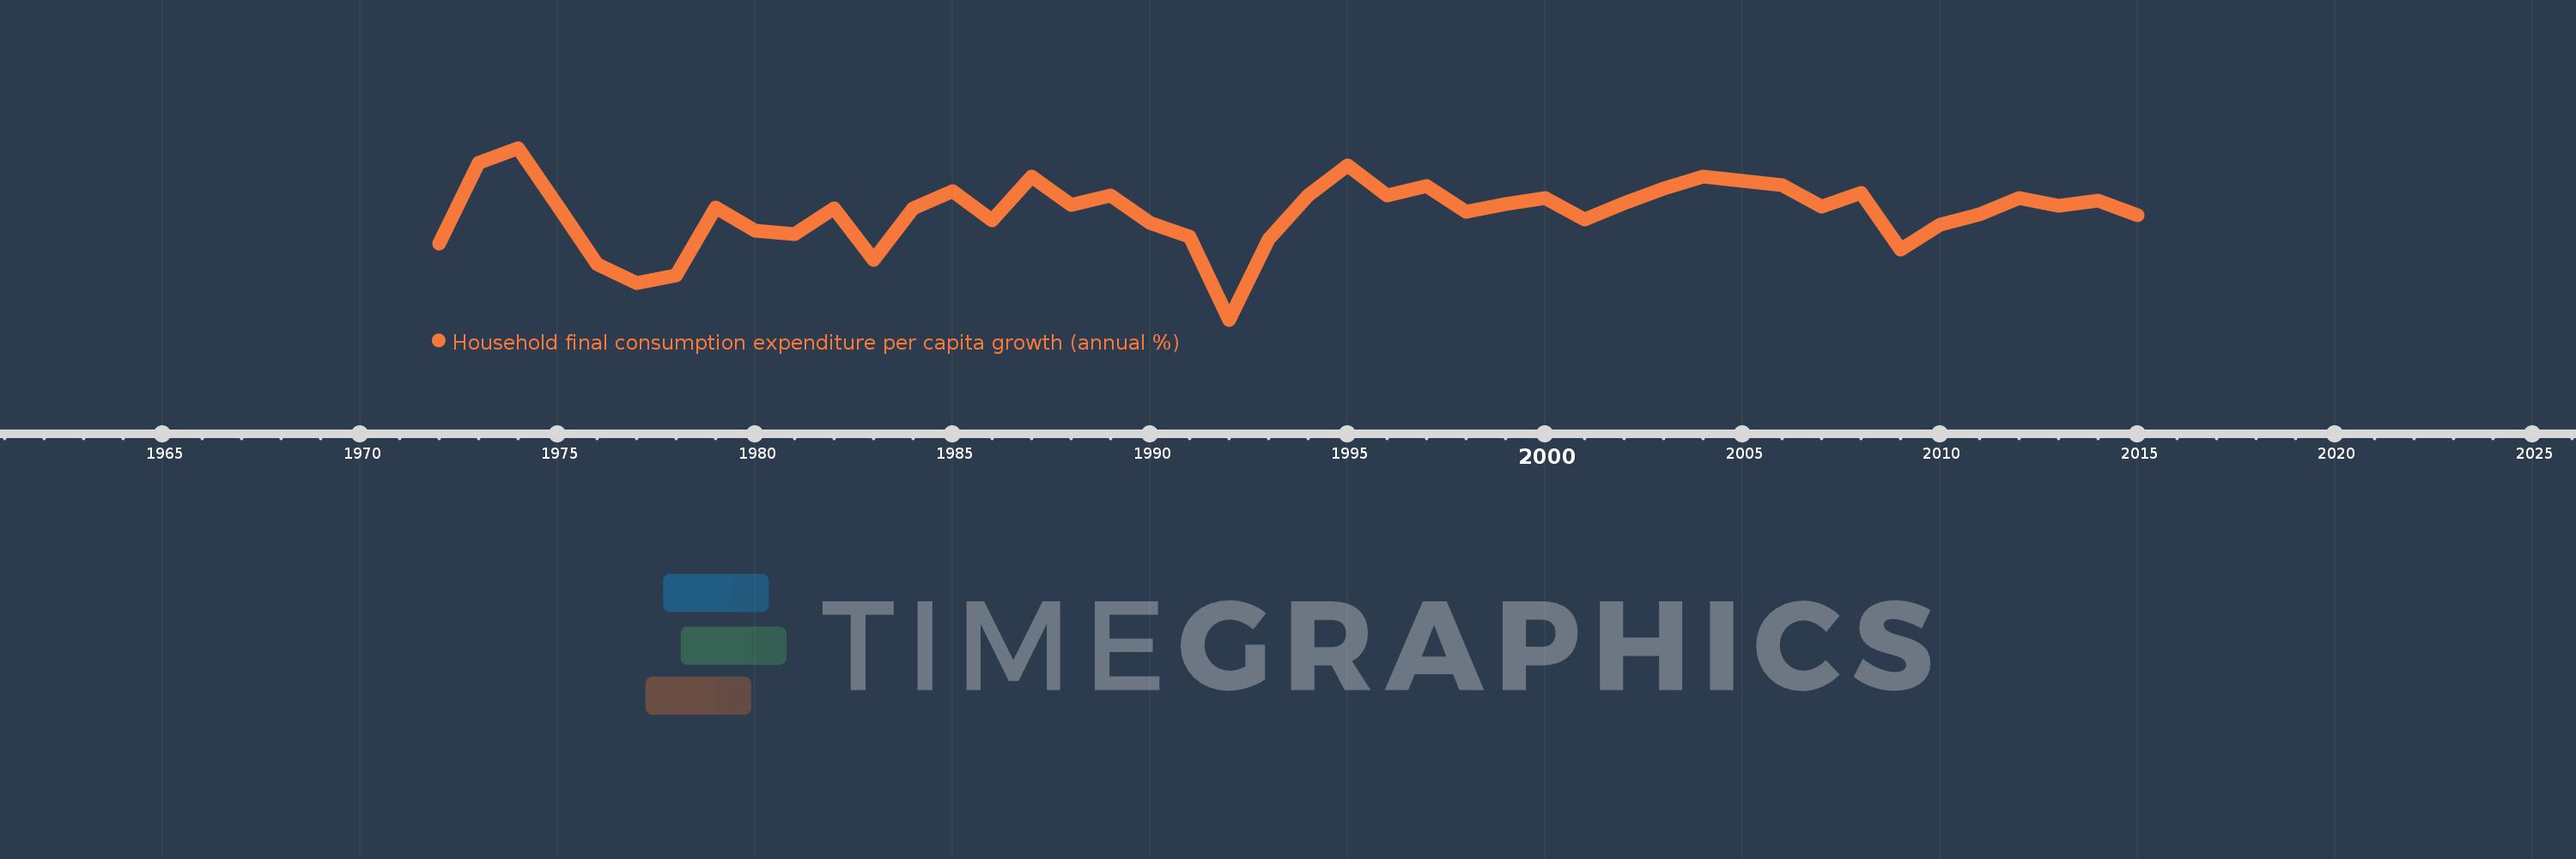
Household final consumption expenditure per capita growth (annual %)
2015,2014,2013,2012,2011,2010,2009,2008,2007,2006,2005,2004,2003,2002,2001,2000,1999,1998,1997,1996,1995,1994,1993,1992,1991,1990,1989,1988,1987,1986,1985,1984,1983,1982,1981,1980,1979,1978,1977,1976,1975,1974,1973,1972
This statistics in other country:
AlbaniaAlgeriaAntigua and BarbudaArab WorldArgentinaArmeniaAustraliaAustriaAzerbaijanBahamas, TheBahrainBangladeshBarbadosBelarusBelgiumBelizeBeninBhutanBoliviaBosnia and HerzegovinaBotswanaBrazilBrunei DarussalamBulgariaBurkina FasoBurundiCabo VerdeCambodiaCameroonCanadaCaribbean small statesCentral Europe and the BalticsChadChileChinaColombiaComorosCongo, Dem. Rep.Congo, Rep.Costa RicaCote d'IvoireCroatiaCubaCyprusCzech RepublicDenmarkDominican RepublicEarly-demographic dividendEast Asia & PacificEast Asia & Pacific (excluding high income)East Asia & Pacific (IDA & IBRD countries)EcuadorEgypt, Arab Rep.El SalvadorEquatorial GuineaEritreaEstoniaEuro areaEurope & Central AsiaEurope & Central Asia (excluding high income)Europe & Central Asia (IDA & IBRD countries)European UnionFinlandFranceGabonGambia, TheGermanyGhanaGreeceGuatemalaGuineaGuinea-BissauHaitiHeavily indebted poor countries (HIPC)High incomeHondurasHong Kong SAR, ChinaHungaryIBRD onlyIcelandIDA & IBRD totalIDA blendIDA onlyIDA totalIndiaIndonesiaIran, Islamic Rep.IrelandIsraelItalyJamaicaJapanJordanKazakhstanKenyaKorea, Rep.KosovoKuwaitKyrgyz RepublicLate-demographic dividendLatin America & Caribbean Latin America & Caribbean (excluding high income)Latin America & the Caribbean (IDA & IBRD countries)LatviaLeast developed countries: UN classificationLebanonLiberiaLithuaniaLow & middle incomeLow incomeLower middle incomeLuxembourgMacao SAR, ChinaMacedonia, FYRMadagascarMalawiMalaysiaMaliMaltaMauritaniaMauritiusMexicoMiddle East & North AfricaMiddle East & North Africa (excluding high income)Middle East & North Africa (IDA & IBRD countries)Middle incomeMoldovaMongoliaMontenegroMoroccoMozambiqueNamibiaNepalNetherlandsNew ZealandNicaraguaNigerNigeriaNorth AmericaNorwayOECD membersOmanOther small statesPakistanPanamaParaguayPeruPhilippinesPolandPortugalPost-demographic dividendPre-demographic dividendPuerto RicoQatarRomaniaRussian FederationRwandaSaudi ArabiaSenegalSerbiaSierra LeoneSingaporeSlovak RepublicSloveniaSmall statesSouth AfricaSouth AsiaSouth Asia (IDA & IBRD)South SudanSpainSri LankaSub-Saharan Africa Sub-Saharan Africa (excluding high income)Sub-Saharan Africa (IDA & IBRD countries)SudanSurinameSwazilandSwedenSwitzerlandTajikistanTanzaniaThailandTimor-LesteTogoTrinidad and TobagoTunisiaTurkeyUgandaUkraineUnited Arab EmiratesUnited KingdomUnited StatesUpper middle incomeUruguayVanuatuVenezuela, RBVietnamWest Bank and GazaWorldZimbabwe Timeline:
This timeline shows a graph from 1972 to 2015 of New Zealand. No data until 1971. Number of actual observations by date: 44.
Source name:
World Development Indicators
Source organization:
World Bank national accounts data, and OECD National Accounts data files.
Categories, topics:
Economy & Growth
Last updated:
apr 23, 2017
Indicators value changes by year
Minimum:
-6.997
jan 1, 1992
At the date of observation
Value
Absolute change
Change from previous value
jan 1, 1972
-1.043
-1.043
0.0%
jan 1, 1973
5.182
+6.225
-596.64%
jan 1, 1974
6.353
+1.171
22.59%
jan 1, 1975
1.865
-4.488
-70.64%
jan 1, 1976
-2.651
-4.516
-242.16%
jan 1, 1977
-4.122
-1.47
55.46%
jan 1, 1978
-3.549
+0.572
-13.89%
jan 1, 1979
1.754
+5.303
-149.42%
jan 1, 1980
-0.081
-1.835
-104.59%
jan 1, 1981
-0.365
-0.285
353.7%
jan 1, 1982
1.654
+2.02
-552.77%
jan 1, 1983
-2.354
-4.008
-242.29%
jan 1, 1984
1.69
+4.044
-171.82%
jan 1, 1985
2.979
+1.289
76.24%
jan 1, 1986
0.743
-2.237
-75.07%
jan 1, 1987
4.144
+3.402
458.01%
jan 1, 1988
1.957
-2.187
-52.78%
jan 1, 1989
2.646
+0.689
35.2%
jan 1, 1990
0.529
-2.116
-80.0%
jan 1, 1991
-0.515
-1.044
-197.36%
jan 1, 1992
-6.997
-6.481
1.26K%
jan 1, 1993
-0.723
+6.273
-89.66%
jan 1, 1994
2.668
+3.391
-468.83%
jan 1, 1995
4.977
+2.309
86.57%
jan 1, 1996
2.647
-2.33
-46.81%
jan 1, 1997
3.371
+0.724
27.35%
jan 1, 1998
1.378
-1.994
-59.14%
jan 1, 1999
2.019
+0.642
46.59%
jan 1, 2000
2.484
+0.465
23.03%
jan 1, 2001
0.809
-1.675
-67.43%
jan 1, 2002
2.077
+1.268
156.64%
jan 1, 2003
3.175
+1.097
52.84%
jan 1, 2004
4.129
+0.955
30.07%
jan 1, 2005
3.808
-0.321
-7.78%
jan 1, 2006
3.444
-0.364
-9.56%
jan 1, 2007
1.793
-1.651
-47.95%
jan 1, 2008
2.894
+1.101
61.44%
jan 1, 2009
-1.535
-4.429
-153.02%
jan 1, 2010
0.39
+1.925
-125.41%
jan 1, 2011
1.21
+0.82
210.31%
jan 1, 2012
2.473
+1.263
104.38%
jan 1, 2013
1.851
-0.622
-25.15%
jan 1, 2014
2.294
+0.443
23.91%
jan 1, 2015
1.095
-1.199
-52.27%
Ranking of countries by current statistics by years


Comments: