29
/
en
AIzaSyAYiBZKx7MnpbEhh9jyipgxe19OcubqV5w
April 1, 2024
268084
Tunisia
TUN
true
2
1
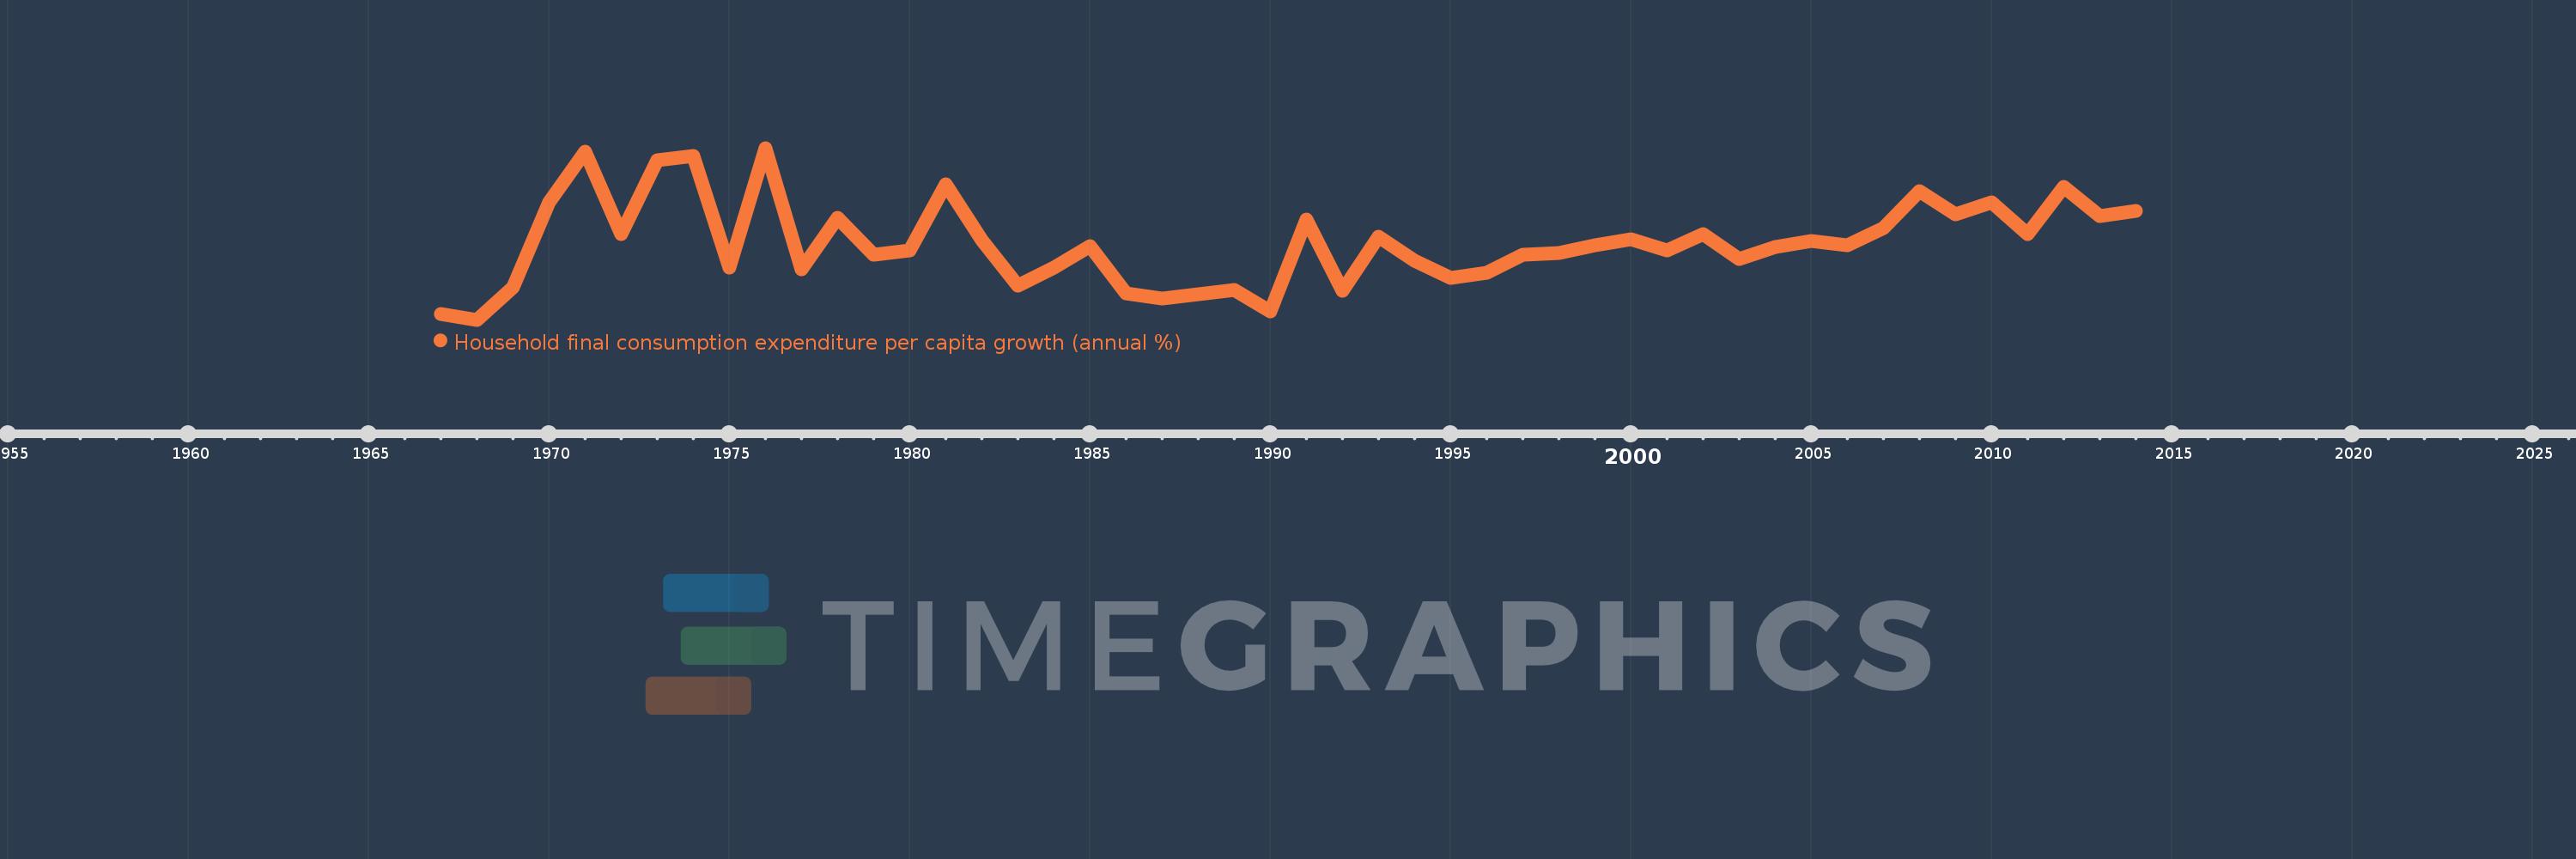
Household final consumption expenditure per capita growth (annual %)
2014,2013,2012,2011,2010,2009,2008,2007,2006,2005,2004,2003,2002,2001,2000,1999,1998,1997,1996,1995,1994,1993,1992,1991,1990,1989,1988,1987,1986,1985,1984,1983,1982,1981,1980,1979,1978,1977,1976,1975,1974,1973,1972,1971,1970,1969,1968,1967
This statistics in other country:
AlbaniaAlgeriaAntigua and BarbudaArab WorldArgentinaArmeniaAustraliaAustriaAzerbaijanBahamas, TheBahrainBangladeshBarbadosBelarusBelgiumBelizeBeninBhutanBoliviaBosnia and HerzegovinaBotswanaBrazilBrunei DarussalamBulgariaBurkina FasoBurundiCabo VerdeCambodiaCameroonCanadaCaribbean small statesCentral Europe and the BalticsChadChileChinaColombiaComorosCongo, Dem. Rep.Congo, Rep.Costa RicaCote d'IvoireCroatiaCubaCyprusCzech RepublicDenmarkDominican RepublicEarly-demographic dividendEast Asia & PacificEast Asia & Pacific (excluding high income)East Asia & Pacific (IDA & IBRD countries)EcuadorEgypt, Arab Rep.El SalvadorEquatorial GuineaEritreaEstoniaEuro areaEurope & Central AsiaEurope & Central Asia (excluding high income)Europe & Central Asia (IDA & IBRD countries)European UnionFinlandFranceGabonGambia, TheGermanyGhanaGreeceGuatemalaGuineaGuinea-BissauHaitiHeavily indebted poor countries (HIPC)High incomeHondurasHong Kong SAR, ChinaHungaryIBRD onlyIcelandIDA & IBRD totalIDA blendIDA onlyIDA totalIndiaIndonesiaIran, Islamic Rep.IrelandIsraelItalyJamaicaJapanJordanKazakhstanKenyaKorea, Rep.KosovoKuwaitKyrgyz RepublicLate-demographic dividendLatin America & Caribbean Latin America & Caribbean (excluding high income)Latin America & the Caribbean (IDA & IBRD countries)LatviaLeast developed countries: UN classificationLebanonLiberiaLithuaniaLow & middle incomeLow incomeLower middle incomeLuxembourgMacao SAR, ChinaMacedonia, FYRMadagascarMalawiMalaysiaMaliMaltaMauritaniaMauritiusMexicoMiddle East & North AfricaMiddle East & North Africa (excluding high income)Middle East & North Africa (IDA & IBRD countries)Middle incomeMoldovaMongoliaMontenegroMoroccoMozambiqueNamibiaNepalNetherlandsNew ZealandNicaraguaNigerNigeriaNorth AmericaNorwayOECD membersOmanOther small statesPakistanPanamaParaguayPeruPhilippinesPolandPortugalPost-demographic dividendPre-demographic dividendPuerto RicoQatarRomaniaRussian FederationRwandaSaudi ArabiaSenegalSerbiaSierra LeoneSingaporeSlovak RepublicSloveniaSmall statesSouth AfricaSouth AsiaSouth Asia (IDA & IBRD)South SudanSpainSri LankaSub-Saharan Africa Sub-Saharan Africa (excluding high income)Sub-Saharan Africa (IDA & IBRD countries)SudanSurinameSwazilandSwedenSwitzerlandTajikistanTanzaniaThailandTimor-LesteTogoTrinidad and TobagoTunisiaTurkeyUgandaUkraineUnited Arab EmiratesUnited KingdomUnited StatesUpper middle incomeUruguayVanuatuVenezuela, RBVietnamWest Bank and GazaWorldZimbabwe Timeline:
This timeline shows a graph from 1967 to 2014 of Tunisia. No data until 1966. Number of actual observations by date: 48.
Source name:
World Development Indicators
Source organization:
World Bank national accounts data, and OECD National Accounts data files.
Categories, topics:
Economy & Growth
Last updated:
apr 23, 2017
Indicators value changes by year
Minimum:
-3.575
jan 1, 1968
Maximum:
13.443
jan 1, 1976
At the date of observation
Value
Absolute change
Change from previous value
jan 1, 1967
-2.982
-2.982
0.0%
jan 1, 1968
-3.575
-0.593
19.9%
jan 1, 1969
-0.391
+3.184
-89.05%
jan 1, 1970
8.041
+8.432
-2.15K%
jan 1, 1971
13.064
+5.023
62.48%
jan 1, 1972
4.933
-8.131
-62.24%
jan 1, 1973
12.232
+7.299
147.97%
jan 1, 1974
12.617
+0.385
3.15%
jan 1, 1975
1.628
-10.989
-87.1%
jan 1, 1976
13.443
+11.815
725.67%
jan 1, 1977
1.427
-12.016
-89.39%
jan 1, 1978
6.56
+5.133
359.73%
jan 1, 1979
2.866
-3.694
-56.32%
jan 1, 1980
3.297
+0.431
15.05%
jan 1, 1981
9.821
+6.524
197.9%
jan 1, 1982
4.318
-5.503
-56.03%
jan 1, 1983
-0.177
-4.495
-104.09%
jan 1, 1984
1.618
+1.795
-1.02K%
jan 1, 1985
3.678
+2.06
127.27%
jan 1, 1986
-0.931
-4.609
-125.3%
jan 1, 1987
-1.44
-0.51
54.8%
jan 1, 1988
-1.043
+0.397
-27.57%
jan 1, 1989
-0.632
+0.412
-39.45%
jan 1, 1990
-2.777
-2.146
339.7%
jan 1, 1991
6.364
+9.142
-329.15%
jan 1, 1992
-0.725
-7.09
-111.4%
jan 1, 1993
4.689
+5.414
-746.29%
jan 1, 1994
2.308
-2.38
-50.77%
jan 1, 1995
0.569
-1.739
-75.36%
jan 1, 1996
1.041
+0.473
83.09%
jan 1, 1997
2.869
+1.827
175.46%
jan 1, 1998
3.078
+0.209
7.29%
jan 1, 1999
3.818
+0.74
24.05%
jan 1, 2000
4.421
+0.603
15.8%
jan 1, 2001
3.276
-1.146
-25.91%
jan 1, 2002
4.912
+1.636
49.96%
jan 1, 2003
2.459
-2.453
-49.94%
jan 1, 2004
3.629
+1.17
47.57%
jan 1, 2005
4.198
+0.568
15.66%
jan 1, 2006
3.803
-0.395
-9.41%
jan 1, 2007
5.516
+1.713
45.05%
jan 1, 2008
9.204
+3.688
66.87%
jan 1, 2009
6.893
-2.311
-25.11%
jan 1, 2010
8.048
+1.155
16.75%
jan 1, 2011
4.887
-3.16
-39.27%
jan 1, 2012
9.595
+4.707
96.32%
jan 1, 2013
6.715
-2.879
-30.01%
jan 1, 2014
7.176
+0.46
6.86%
Ranking of countries by current statistics by years


Comments: