29
/
en
AIzaSyAYiBZKx7MnpbEhh9jyipgxe19OcubqV5w
April 1, 2024
49071
Middle East & North Africa (excluding high income)
MNA
false
2
1
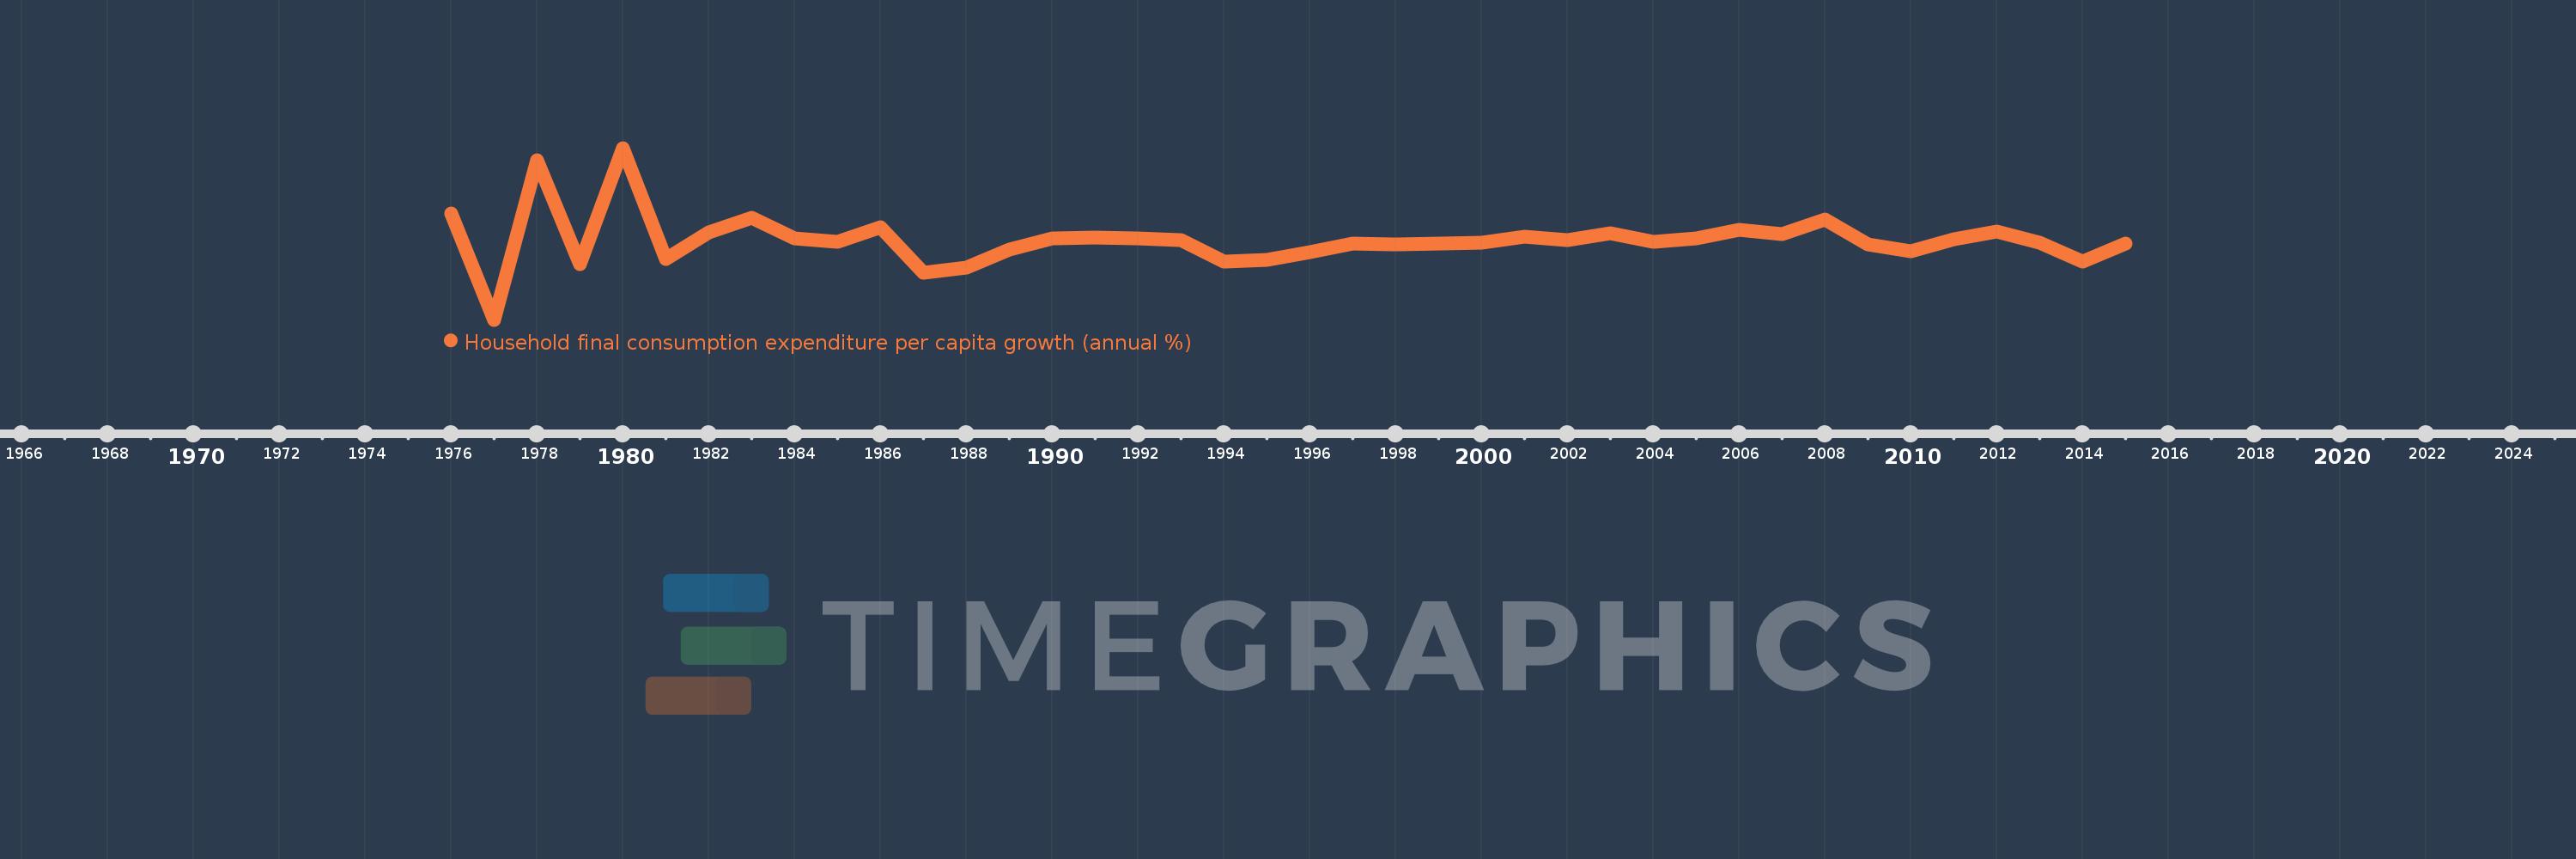
Household final consumption expenditure per capita growth (annual %)
2015,2014,2013,2012,2011,2010,2009,2008,2007,2006,2005,2004,2003,2002,2001,2000,1999,1998,1997,1996,1995,1994,1993,1992,1991,1990,1989,1988,1987,1986,1985,1984,1983,1982,1981,1980,1979,1978,1977,1976
This statistics in other country:
AlbaniaAlgeriaAntigua and BarbudaArab WorldArgentinaArmeniaAustraliaAustriaAzerbaijanBahamas, TheBahrainBangladeshBarbadosBelarusBelgiumBelizeBeninBhutanBoliviaBosnia and HerzegovinaBotswanaBrazilBrunei DarussalamBulgariaBurkina FasoBurundiCabo VerdeCambodiaCameroonCanadaCaribbean small statesCentral Europe and the BalticsChadChileChinaColombiaComorosCongo, Dem. Rep.Congo, Rep.Costa RicaCote d'IvoireCroatiaCubaCyprusCzech RepublicDenmarkDominican RepublicEarly-demographic dividendEast Asia & PacificEast Asia & Pacific (excluding high income)East Asia & Pacific (IDA & IBRD countries)EcuadorEgypt, Arab Rep.El SalvadorEquatorial GuineaEritreaEstoniaEuro areaEurope & Central AsiaEurope & Central Asia (excluding high income)Europe & Central Asia (IDA & IBRD countries)European UnionFinlandFranceGabonGambia, TheGermanyGhanaGreeceGuatemalaGuineaGuinea-BissauHaitiHeavily indebted poor countries (HIPC)High incomeHondurasHong Kong SAR, ChinaHungaryIBRD onlyIcelandIDA & IBRD totalIDA blendIDA onlyIDA totalIndiaIndonesiaIran, Islamic Rep.IrelandIsraelItalyJamaicaJapanJordanKazakhstanKenyaKorea, Rep.KosovoKuwaitKyrgyz RepublicLate-demographic dividendLatin America & Caribbean Latin America & Caribbean (excluding high income)Latin America & the Caribbean (IDA & IBRD countries)LatviaLeast developed countries: UN classificationLebanonLiberiaLithuaniaLow & middle incomeLow incomeLower middle incomeLuxembourgMacao SAR, ChinaMacedonia, FYRMadagascarMalawiMalaysiaMaliMaltaMauritaniaMauritiusMexicoMiddle East & North AfricaMiddle East & North Africa (excluding high income)Middle East & North Africa (IDA & IBRD countries)Middle incomeMoldovaMongoliaMontenegroMoroccoMozambiqueNamibiaNepalNetherlandsNew ZealandNicaraguaNigerNigeriaNorth AmericaNorwayOECD membersOmanOther small statesPakistanPanamaParaguayPeruPhilippinesPolandPortugalPost-demographic dividendPre-demographic dividendPuerto RicoQatarRomaniaRussian FederationRwandaSaudi ArabiaSenegalSerbiaSierra LeoneSingaporeSlovak RepublicSloveniaSmall statesSouth AfricaSouth AsiaSouth Asia (IDA & IBRD)South SudanSpainSri LankaSub-Saharan Africa Sub-Saharan Africa (excluding high income)Sub-Saharan Africa (IDA & IBRD countries)SudanSurinameSwazilandSwedenSwitzerlandTajikistanTanzaniaThailandTimor-LesteTogoTrinidad and TobagoTunisiaTurkeyUgandaUkraineUnited Arab EmiratesUnited KingdomUnited StatesUpper middle incomeUruguayVanuatuVenezuela, RBVietnamWest Bank and GazaWorldZimbabwe Timeline:
This timeline shows a graph from 1976 to 2015 of Middle East & North Africa (excluding high income). No data until 1975. Number of actual observations by date: 40.
Source name:
World Development Indicators
Source organization:
World Bank national accounts data, and OECD National Accounts data files.
Categories, topics:
Economy & Growth
Last updated:
apr 23, 2017
Indicators value changes by year
Minimum:
-18.368
jan 1, 1977
Maximum:
26.119
jan 1, 1980
At the date of observation
Value
Absolute change
Change from previous value
jan 1, 1976
9.137
+9.137
0.0%
jan 1, 1977
-18.368
-27.505
-301.03%
jan 1, 1978
22.974
+41.342
-225.08%
jan 1, 1979
-3.953
-26.927
-117.21%
jan 1, 1980
26.119
+30.073
-760.7%
jan 1, 1981
-2.682
-28.801
-110.27%
jan 1, 1982
4.149
+6.831
-254.68%
jan 1, 1983
8.074
+3.925
94.61%
jan 1, 1984
2.688
-5.386
-66.71%
jan 1, 1985
1.709
-0.979
-36.43%
jan 1, 1986
5.502
+3.793
221.98%
jan 1, 1987
-6.239
-11.74
-213.4%
jan 1, 1988
-4.957
+1.281
-20.54%
jan 1, 1989
-0.09
+4.867
-98.19%
jan 1, 1990
2.595
+2.685
-2.99K%
jan 1, 1991
2.839
+0.244
9.41%
jan 1, 1992
2.644
-0.195
-6.86%
jan 1, 1993
2.261
-0.383
-14.5%
jan 1, 1994
-3.243
-5.504
-243.41%
jan 1, 1995
-2.974
+0.269
-8.3%
jan 1, 1996
-0.946
+2.027
-68.18%
jan 1, 1997
1.461
+2.408
-254.41%
jan 1, 1998
1.176
-0.286
-19.54%
jan 1, 1999
1.399
+0.223
19.0%
jan 1, 2000
1.543
+0.144
10.27%
jan 1, 2001
3.152
+1.609
104.31%
jan 1, 2002
2.309
-0.842
-26.73%
jan 1, 2003
3.968
+1.658
71.8%
jan 1, 2004
1.907
-2.06
-51.93%
jan 1, 2005
2.72
+0.813
42.62%
jan 1, 2006
4.859
+2.139
78.63%
jan 1, 2007
3.793
-1.065
-21.93%
jan 1, 2008
7.509
+3.716
97.97%
jan 1, 2009
1.223
-6.287
-83.72%
jan 1, 2010
-0.616
-1.839
-150.35%
jan 1, 2011
2.413
+3.029
-491.87%
jan 1, 2012
4.554
+2.141
88.74%
jan 1, 2013
1.601
-2.953
-64.84%
jan 1, 2014
-3.208
-4.809
-300.34%
jan 1, 2015
1.28
+4.488
-139.9%
Ranking of countries by current statistics by years


Comments: