29
/
en
AIzaSyAYiBZKx7MnpbEhh9jyipgxe19OcubqV5w
April 1, 2024
248814
Sri Lanka
LKA
true
2
1
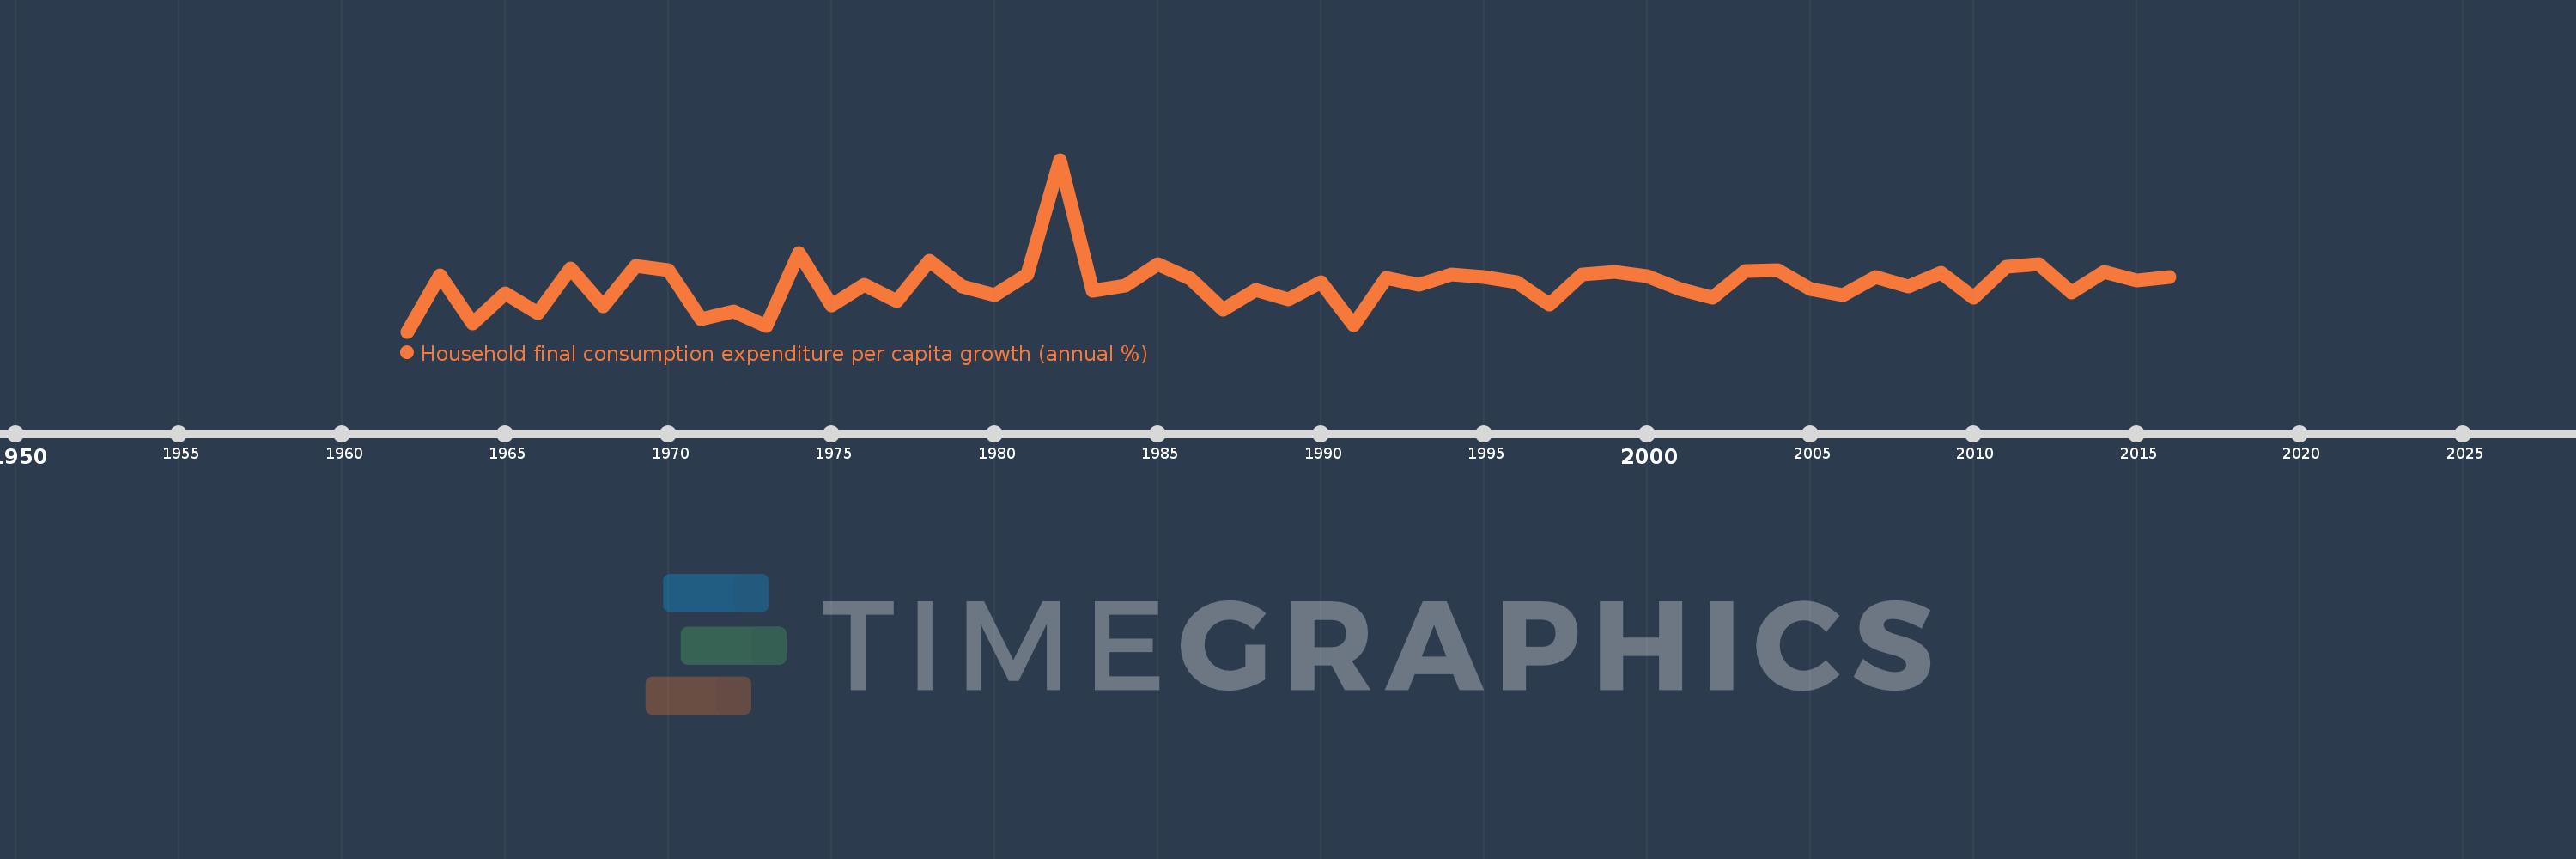
Household final consumption expenditure per capita growth (annual %)
2016,2015,2014,2013,2012,2011,2010,2009,2008,2007,2006,2005,2004,2003,2002,2001,2000,1999,1998,1997,1996,1995,1994,1993,1992,1991,1990,1989,1988,1987,1986,1985,1984,1983,1982,1981,1980,1979,1978,1977,1976,1975,1974,1973,1972,1971,1970,1969,1968,1967,1966,1965,1964,1963,1962
This statistics in other country:
AlbaniaAlgeriaAntigua and BarbudaArab WorldArgentinaArmeniaAustraliaAustriaAzerbaijanBahamas, TheBahrainBangladeshBarbadosBelarusBelgiumBelizeBeninBhutanBoliviaBosnia and HerzegovinaBotswanaBrazilBrunei DarussalamBulgariaBurkina FasoBurundiCabo VerdeCambodiaCameroonCanadaCaribbean small statesCentral Europe and the BalticsChadChileChinaColombiaComorosCongo, Dem. Rep.Congo, Rep.Costa RicaCote d'IvoireCroatiaCubaCyprusCzech RepublicDenmarkDominican RepublicEarly-demographic dividendEast Asia & PacificEast Asia & Pacific (excluding high income)East Asia & Pacific (IDA & IBRD countries)EcuadorEgypt, Arab Rep.El SalvadorEquatorial GuineaEritreaEstoniaEuro areaEurope & Central AsiaEurope & Central Asia (excluding high income)Europe & Central Asia (IDA & IBRD countries)European UnionFinlandFranceGabonGambia, TheGermanyGhanaGreeceGuatemalaGuineaGuinea-BissauHaitiHeavily indebted poor countries (HIPC)High incomeHondurasHong Kong SAR, ChinaHungaryIBRD onlyIcelandIDA & IBRD totalIDA blendIDA onlyIDA totalIndiaIndonesiaIran, Islamic Rep.IrelandIsraelItalyJamaicaJapanJordanKazakhstanKenyaKorea, Rep.KosovoKuwaitKyrgyz RepublicLate-demographic dividendLatin America & Caribbean Latin America & Caribbean (excluding high income)Latin America & the Caribbean (IDA & IBRD countries)LatviaLeast developed countries: UN classificationLebanonLiberiaLithuaniaLow & middle incomeLow incomeLower middle incomeLuxembourgMacao SAR, ChinaMacedonia, FYRMadagascarMalawiMalaysiaMaliMaltaMauritaniaMauritiusMexicoMiddle East & North AfricaMiddle East & North Africa (excluding high income)Middle East & North Africa (IDA & IBRD countries)Middle incomeMoldovaMongoliaMontenegroMoroccoMozambiqueNamibiaNepalNetherlandsNew ZealandNicaraguaNigerNigeriaNorth AmericaNorwayOECD membersOmanOther small statesPakistanPanamaParaguayPeruPhilippinesPolandPortugalPost-demographic dividendPre-demographic dividendPuerto RicoQatarRomaniaRussian FederationRwandaSaudi ArabiaSenegalSerbiaSierra LeoneSingaporeSlovak RepublicSloveniaSmall statesSouth AfricaSouth AsiaSouth Asia (IDA & IBRD)South SudanSpainSri LankaSub-Saharan Africa Sub-Saharan Africa (excluding high income)Sub-Saharan Africa (IDA & IBRD countries)SudanSurinameSwazilandSwedenSwitzerlandTajikistanTanzaniaThailandTimor-LesteTogoTrinidad and TobagoTunisiaTurkeyUgandaUkraineUnited Arab EmiratesUnited KingdomUnited StatesUpper middle incomeUruguayVanuatuVenezuela, RBVietnamWest Bank and GazaWorldZimbabwe Timeline:
This timeline shows a graph from 1962 to 2016 of Sri Lanka. No data until 1961. Number of actual observations by date: 55.
Source name:
World Development Indicators
Source organization:
World Bank national accounts data, and OECD National Accounts data files.
Categories, topics:
Economy & Growth
Last updated:
apr 23, 2017
Indicators value changes by year
Minimum:
-8.841
jan 1, 1962
Maximum:
36.794
jan 1, 1982
At the date of observation
Value
Absolute change
Change from previous value
jan 1, 1962
-8.841
-8.841
0.0%
jan 1, 1963
6.175
+15.016
-169.85%
jan 1, 1964
-6.781
-12.956
-209.8%
jan 1, 1965
1.37
+8.151
-120.2%
jan 1, 1966
-3.829
-5.199
-379.46%
jan 1, 1967
7.855
+11.683
-305.15%
jan 1, 1968
-2.084
-9.938
-126.53%
jan 1, 1969
8.523
+10.607
-509.03%
jan 1, 1970
7.485
-1.038
-12.17%
jan 1, 1971
-5.499
-12.984
-173.46%
jan 1, 1972
-3.38
+2.119
-38.53%
jan 1, 1973
-7.424
-4.044
119.66%
jan 1, 1974
11.942
+19.367
-260.86%
jan 1, 1975
-1.781
-13.723
-114.91%
jan 1, 1976
3.507
+5.288
-296.97%
jan 1, 1977
-0.751
-4.258
-121.4%
jan 1, 1978
10.091
+10.841
-1.44K%
jan 1, 1979
3.06
-7.03
-69.67%
jan 1, 1980
0.921
-2.139
-69.89%
jan 1, 1981
6.303
+5.382
584.09%
jan 1, 1982
36.794
+30.491
483.72%
jan 1, 1983
1.941
-34.854
-94.73%
jan 1, 1984
3.38
+1.44
74.18%
jan 1, 1985
8.991
+5.61
165.97%
jan 1, 1986
5.26
-3.731
-41.5%
jan 1, 1987
-3.024
-8.284
-157.5%
jan 1, 1988
2.175
+5.199
-171.92%
jan 1, 1989
-0.218
-2.393
-110.03%
jan 1, 1990
4.314
+4.532
-2.08K%
jan 1, 1991
-7.174
-11.488
-266.31%
jan 1, 1992
5.5
+12.674
-176.67%
jan 1, 1993
3.676
-1.824
-33.16%
jan 1, 1994
6.312
+2.635
71.68%
jan 1, 1995
5.537
-0.775
-12.28%
jan 1, 1996
4.186
-1.351
-24.4%
jan 1, 1997
-1.734
-5.92
-141.44%
jan 1, 1998
6.366
+8.1
-467.03%
jan 1, 1999
6.928
+0.562
8.83%
jan 1, 2000
5.777
-1.151
-16.62%
jan 1, 2001
2.563
-3.213
-55.62%
jan 1, 2002
0.083
-2.481
-96.77%
jan 1, 2003
7.296
+7.214
8.72K%
jan 1, 2004
7.484
+0.187
2.57%
jan 1, 2005
2.482
-5.001
-66.83%
jan 1, 2006
0.885
-1.597
-64.35%
jan 1, 2007
5.747
+4.862
549.42%
jan 1, 2008
3.156
-2.591
-45.09%
jan 1, 2009
6.703
+3.547
112.37%
jan 1, 2010
0.18
-6.523
-97.32%
jan 1, 2011
8.338
+8.158
4.54K%
jan 1, 2012
9.068
+0.73
8.76%
jan 1, 2013
1.48
-7.588
-83.68%
jan 1, 2014
6.983
+5.503
371.8%
jan 1, 2015
4.681
-2.301
-32.96%
jan 1, 2016
5.548
+0.866
18.5%
Ranking of countries by current statistics by years


Comments: