29
/
en
AIzaSyAYiBZKx7MnpbEhh9jyipgxe19OcubqV5w
April 1, 2024
30752
Europe & Central Asia
ECS
false
2
1
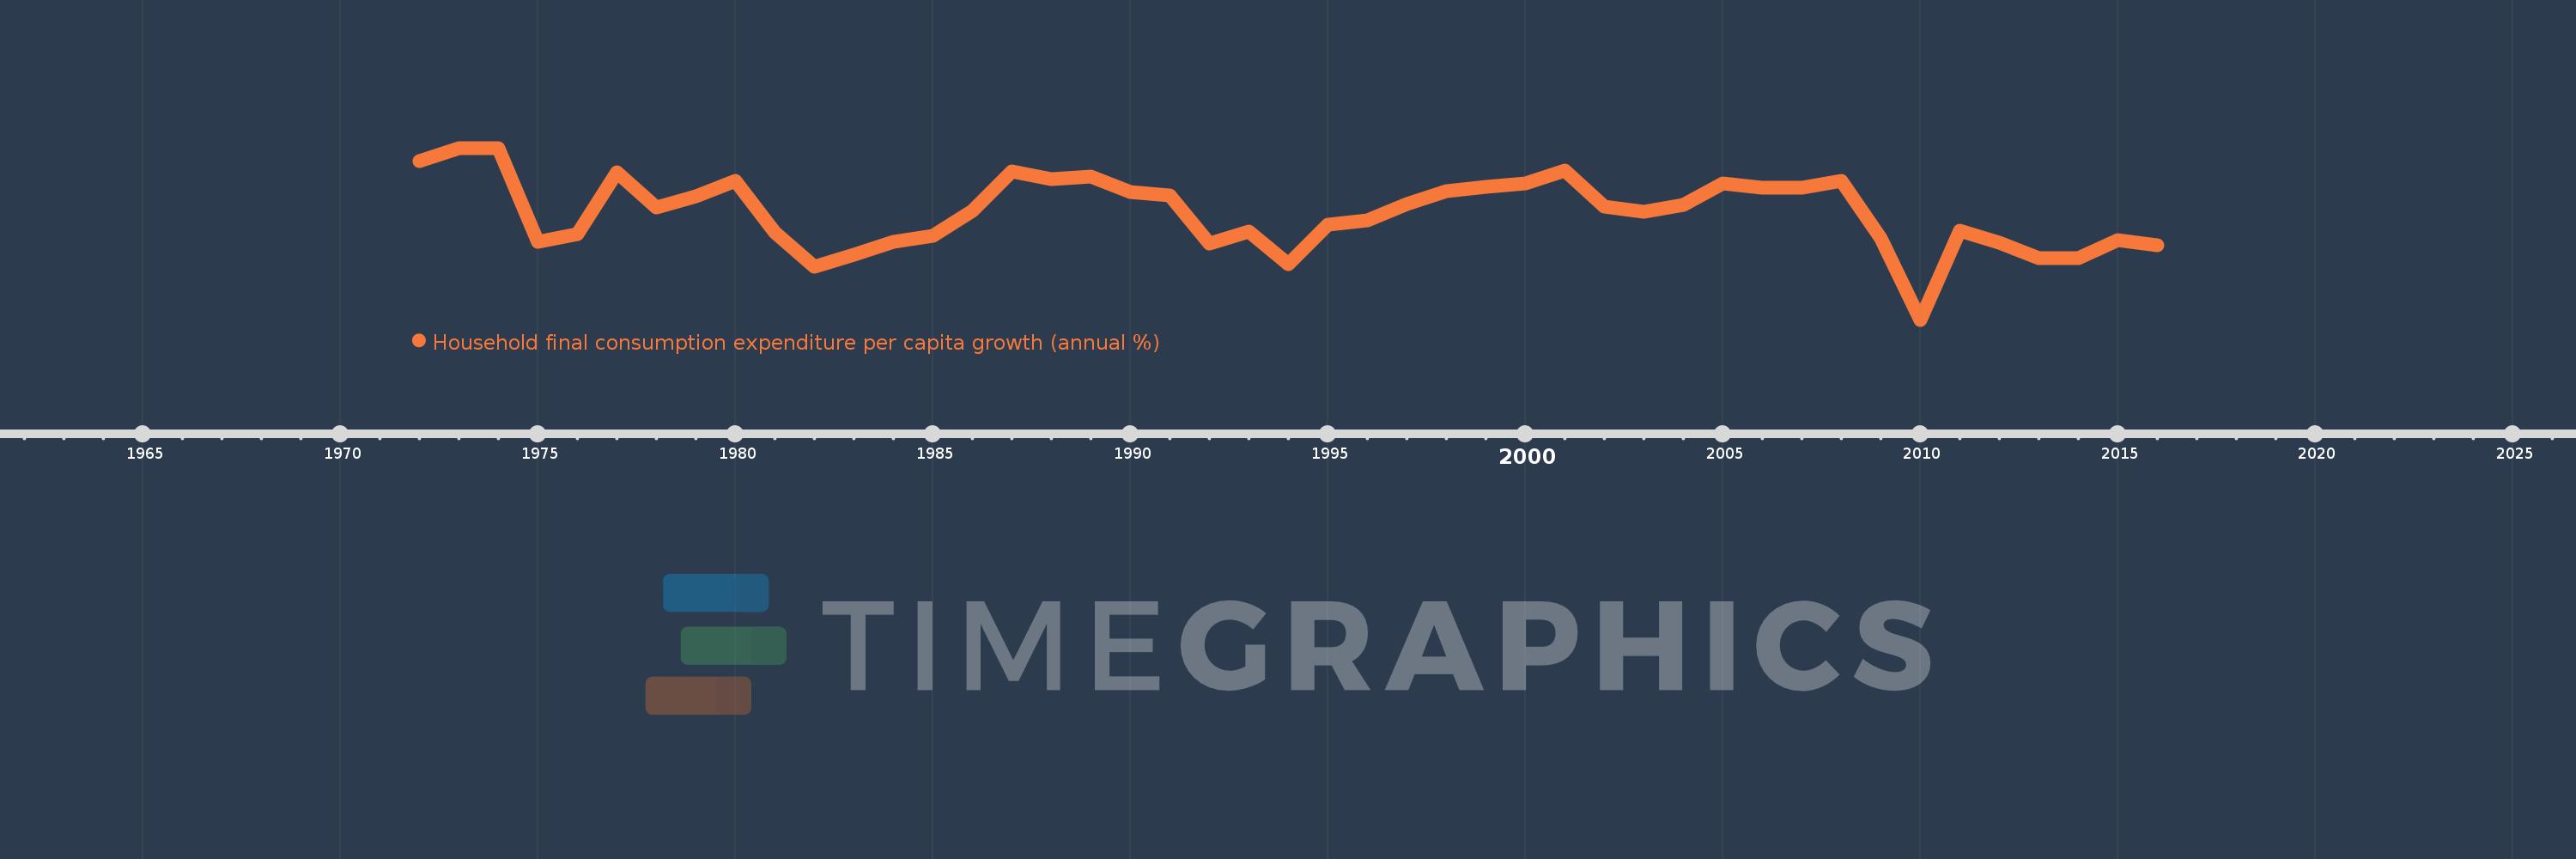
Household final consumption expenditure per capita growth (annual %)
2016,2015,2014,2013,2012,2011,2010,2009,2008,2007,2006,2005,2004,2003,2002,2001,2000,1999,1998,1997,1996,1995,1994,1993,1992,1991,1990,1989,1988,1987,1986,1985,1984,1983,1982,1981,1980,1979,1978,1977,1976,1975,1974,1973,1972
This statistics in other country:
AlbaniaAlgeriaAntigua and BarbudaArab WorldArgentinaArmeniaAustraliaAustriaAzerbaijanBahamas, TheBahrainBangladeshBarbadosBelarusBelgiumBelizeBeninBhutanBoliviaBosnia and HerzegovinaBotswanaBrazilBrunei DarussalamBulgariaBurkina FasoBurundiCabo VerdeCambodiaCameroonCanadaCaribbean small statesCentral Europe and the BalticsChadChileChinaColombiaComorosCongo, Dem. Rep.Congo, Rep.Costa RicaCote d'IvoireCroatiaCubaCyprusCzech RepublicDenmarkDominican RepublicEarly-demographic dividendEast Asia & PacificEast Asia & Pacific (excluding high income)East Asia & Pacific (IDA & IBRD countries)EcuadorEgypt, Arab Rep.El SalvadorEquatorial GuineaEritreaEstoniaEuro areaEurope & Central AsiaEurope & Central Asia (excluding high income)Europe & Central Asia (IDA & IBRD countries)European UnionFinlandFranceGabonGambia, TheGermanyGhanaGreeceGuatemalaGuineaGuinea-BissauHaitiHeavily indebted poor countries (HIPC)High incomeHondurasHong Kong SAR, ChinaHungaryIBRD onlyIcelandIDA & IBRD totalIDA blendIDA onlyIDA totalIndiaIndonesiaIran, Islamic Rep.IrelandIsraelItalyJamaicaJapanJordanKazakhstanKenyaKorea, Rep.KosovoKuwaitKyrgyz RepublicLate-demographic dividendLatin America & Caribbean Latin America & Caribbean (excluding high income)Latin America & the Caribbean (IDA & IBRD countries)LatviaLeast developed countries: UN classificationLebanonLiberiaLithuaniaLow & middle incomeLow incomeLower middle incomeLuxembourgMacao SAR, ChinaMacedonia, FYRMadagascarMalawiMalaysiaMaliMaltaMauritaniaMauritiusMexicoMiddle East & North AfricaMiddle East & North Africa (excluding high income)Middle East & North Africa (IDA & IBRD countries)Middle incomeMoldovaMongoliaMontenegroMoroccoMozambiqueNamibiaNepalNetherlandsNew ZealandNicaraguaNigerNigeriaNorth AmericaNorwayOECD membersOmanOther small statesPakistanPanamaParaguayPeruPhilippinesPolandPortugalPost-demographic dividendPre-demographic dividendPuerto RicoQatarRomaniaRussian FederationRwandaSaudi ArabiaSenegalSerbiaSierra LeoneSingaporeSlovak RepublicSloveniaSmall statesSouth AfricaSouth AsiaSouth Asia (IDA & IBRD)South SudanSpainSri LankaSub-Saharan Africa Sub-Saharan Africa (excluding high income)Sub-Saharan Africa (IDA & IBRD countries)SudanSurinameSwazilandSwedenSwitzerlandTajikistanTanzaniaThailandTimor-LesteTogoTrinidad and TobagoTunisiaTurkeyUgandaUkraineUnited Arab EmiratesUnited KingdomUnited StatesUpper middle incomeUruguayVanuatuVenezuela, RBVietnamWest Bank and GazaWorldZimbabwe Timeline:
This timeline shows a graph from 1972 to 2016 of Europe & Central Asia. No data until 1971. Number of actual observations by date: 45.
Source name:
World Development Indicators
Source organization:
World Bank national accounts data, and OECD National Accounts data files.
Categories, topics:
Economy & Growth
Last updated:
apr 23, 2017
Indicators value changes by year
Minimum:
-2.184
jan 1, 2010
At the date of observation
Value
Absolute change
Change from previous value
jan 1, 1972
3.746
+3.746
0.0%
jan 1, 1973
4.227
+0.482
12.85%
jan 1, 1974
4.239
+0.012
0.28%
jan 1, 1975
0.724
-3.515
-82.91%
jan 1, 1976
1.033
+0.309
42.6%
jan 1, 1977
3.334
+2.301
222.76%
jan 1, 1978
2.019
-1.315
-39.45%
jan 1, 1979
2.429
+0.41
20.32%
jan 1, 1980
3.01
+0.581
23.9%
jan 1, 1981
1.086
-1.924
-63.92%
jan 1, 1982
-0.198
-1.284
-118.24%
jan 1, 1983
0.245
+0.444
-223.94%
jan 1, 1984
0.744
+0.498
203.08%
jan 1, 1985
0.952
+0.208
28.02%
jan 1, 1986
1.898
+0.945
99.27%
jan 1, 1987
3.377
+1.48
77.97%
jan 1, 1988
3.086
-0.292
-8.64%
jan 1, 1989
3.155
+0.07
2.26%
jan 1, 1990
2.604
-0.552
-17.49%
jan 1, 1991
2.468
-0.135
-5.19%
jan 1, 1992
0.666
-1.802
-73.0%
jan 1, 1993
1.123
+0.457
68.53%
jan 1, 1994
-0.116
-1.239
-110.31%
jan 1, 1995
1.378
+1.494
-1.29K%
jan 1, 1996
1.541
+0.163
11.84%
jan 1, 1997
2.148
+0.607
39.37%
jan 1, 1998
2.639
+0.491
22.85%
jan 1, 1999
2.773
+0.134
5.1%
jan 1, 2000
2.903
+0.129
4.66%
jan 1, 2001
3.387
+0.484
16.68%
jan 1, 2002
2.055
-1.332
-39.33%
jan 1, 2003
1.866
-0.189
-9.19%
jan 1, 2004
2.11
+0.243
13.04%
jan 1, 2005
2.924
+0.815
38.62%
jan 1, 2006
2.763
-0.162
-5.53%
jan 1, 2007
2.74
-0.023
-0.82%
jan 1, 2008
3.017
+0.277
10.12%
jan 1, 2009
0.867
-2.15
-71.26%
jan 1, 2010
-2.184
-3.051
-351.86%
jan 1, 2011
1.135
+3.319
-151.96%
jan 1, 2012
0.711
-0.424
-37.32%
jan 1, 2013
0.111
-0.6
-84.36%
jan 1, 2014
0.103
-0.008
-7.46%
jan 1, 2015
0.781
+0.678
658.29%
jan 1, 2016
0.615
-0.166
-21.22%
Ranking of countries by current statistics by years


Comments: