29
/
en
AIzaSyAYiBZKx7MnpbEhh9jyipgxe19OcubqV5w
April 1, 2024
127440
Equatorial Guinea
GNQ
true
2
1
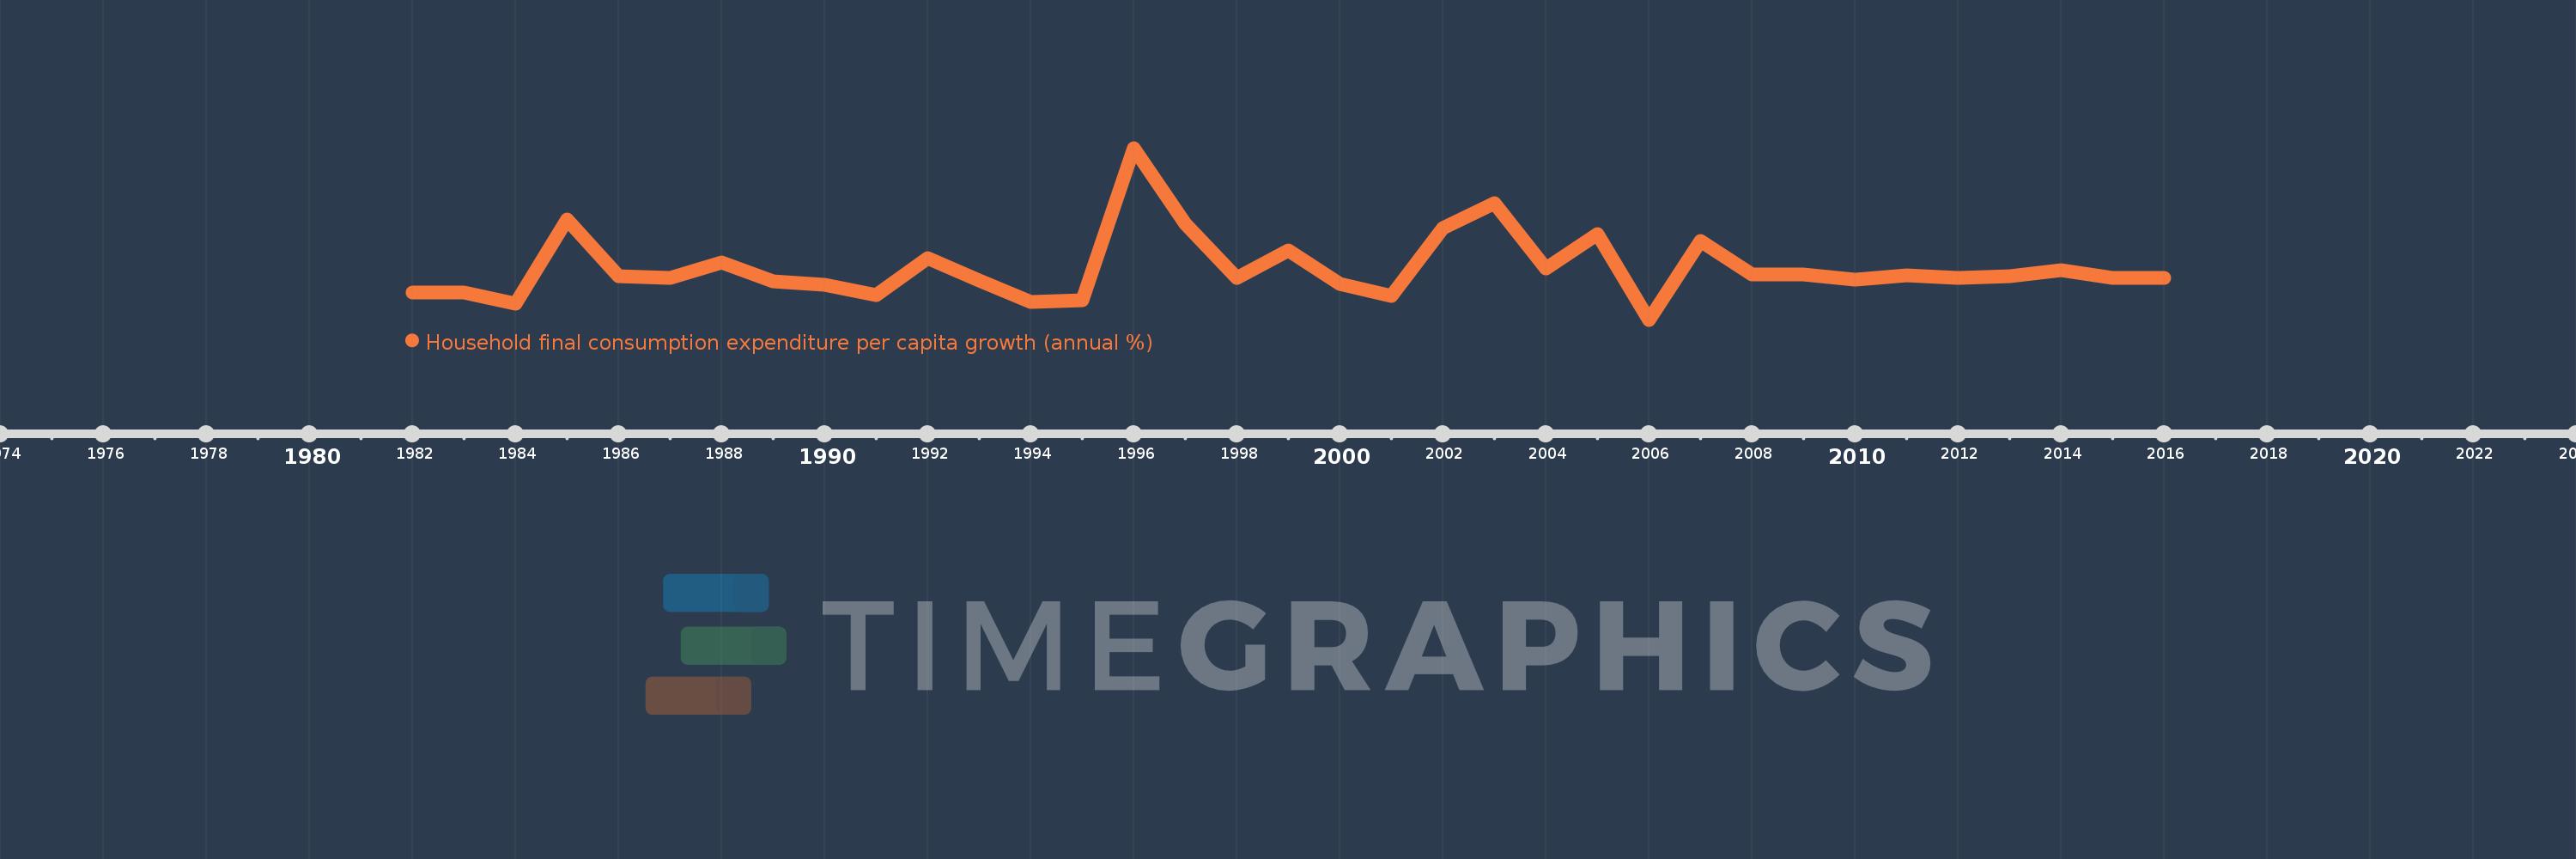
Household final consumption expenditure per capita growth (annual %)
2016,2015,2014,2013,2012,2011,2010,2009,2008,2007,2006,2005,2004,2003,2002,2001,2000,1999,1998,1997,1996,1995,1994,1993,1992,1991,1990,1989,1988,1987,1986,1985,1984,1983,1982
This statistics in other country:
AlbaniaAlgeriaAntigua and BarbudaArab WorldArgentinaArmeniaAustraliaAustriaAzerbaijanBahamas, TheBahrainBangladeshBarbadosBelarusBelgiumBelizeBeninBhutanBoliviaBosnia and HerzegovinaBotswanaBrazilBrunei DarussalamBulgariaBurkina FasoBurundiCabo VerdeCambodiaCameroonCanadaCaribbean small statesCentral Europe and the BalticsChadChileChinaColombiaComorosCongo, Dem. Rep.Congo, Rep.Costa RicaCote d'IvoireCroatiaCubaCyprusCzech RepublicDenmarkDominican RepublicEarly-demographic dividendEast Asia & PacificEast Asia & Pacific (excluding high income)East Asia & Pacific (IDA & IBRD countries)EcuadorEgypt, Arab Rep.El SalvadorEquatorial GuineaEritreaEstoniaEuro areaEurope & Central AsiaEurope & Central Asia (excluding high income)Europe & Central Asia (IDA & IBRD countries)European UnionFinlandFranceGabonGambia, TheGermanyGhanaGreeceGuatemalaGuineaGuinea-BissauHaitiHeavily indebted poor countries (HIPC)High incomeHondurasHong Kong SAR, ChinaHungaryIBRD onlyIcelandIDA & IBRD totalIDA blendIDA onlyIDA totalIndiaIndonesiaIran, Islamic Rep.IrelandIsraelItalyJamaicaJapanJordanKazakhstanKenyaKorea, Rep.KosovoKuwaitKyrgyz RepublicLate-demographic dividendLatin America & Caribbean Latin America & Caribbean (excluding high income)Latin America & the Caribbean (IDA & IBRD countries)LatviaLeast developed countries: UN classificationLebanonLiberiaLithuaniaLow & middle incomeLow incomeLower middle incomeLuxembourgMacao SAR, ChinaMacedonia, FYRMadagascarMalawiMalaysiaMaliMaltaMauritaniaMauritiusMexicoMiddle East & North AfricaMiddle East & North Africa (excluding high income)Middle East & North Africa (IDA & IBRD countries)Middle incomeMoldovaMongoliaMontenegroMoroccoMozambiqueNamibiaNepalNetherlandsNew ZealandNicaraguaNigerNigeriaNorth AmericaNorwayOECD membersOmanOther small statesPakistanPanamaParaguayPeruPhilippinesPolandPortugalPost-demographic dividendPre-demographic dividendPuerto RicoQatarRomaniaRussian FederationRwandaSaudi ArabiaSenegalSerbiaSierra LeoneSingaporeSlovak RepublicSloveniaSmall statesSouth AfricaSouth AsiaSouth Asia (IDA & IBRD)South SudanSpainSri LankaSub-Saharan Africa Sub-Saharan Africa (excluding high income)Sub-Saharan Africa (IDA & IBRD countries)SudanSurinameSwazilandSwedenSwitzerlandTajikistanTanzaniaThailandTimor-LesteTogoTrinidad and TobagoTunisiaTurkeyUgandaUkraineUnited Arab EmiratesUnited KingdomUnited StatesUpper middle incomeUruguayVanuatuVenezuela, RBVietnamWest Bank and GazaWorldZimbabwe Timeline:
This timeline shows a graph from 1982 to 2016 of Equatorial Guinea. No data until 1981. Number of actual observations by date: 35.
Source name:
World Development Indicators
Source organization:
World Bank national accounts data, and OECD National Accounts data files.
Categories, topics:
Economy & Growth
Last updated:
apr 23, 2017
Indicators value changes by year
Minimum:
-67.451
jan 1, 2006
Maximum:
215.057
jan 1, 1996
At the date of observation
Value
Absolute change
Change from previous value
jan 1, 1982
-22.628
-22.628
0.0%
jan 1, 1983
-22.295
+0.333
-1.47%
jan 1, 1984
-41.301
-19.006
85.24%
jan 1, 1985
98.07
+139.371
-337.45%
jan 1, 1986
3.907
-94.162
-96.02%
jan 1, 1987
0.786
-3.121
-79.88%
jan 1, 1988
26.06
+25.274
3.21K%
jan 1, 1989
-4.599
-30.659
-117.65%
jan 1, 1990
-9.644
-5.045
109.71%
jan 1, 1991
-26.591
-16.947
175.73%
jan 1, 1992
34.192
+60.783
-228.59%
jan 1, 1993
-2.631
-36.824
-107.7%
jan 1, 1994
-37.99
-35.358
1.34K%
jan 1, 1995
-34.801
+3.189
-8.4%
jan 1, 1996
215.057
+249.858
-717.97%
jan 1, 1997
89.776
-125.281
-58.25%
jan 1, 1998
1.607
-88.17
-98.21%
jan 1, 1999
45.897
+44.29
2.76K%
jan 1, 2000
-8.377
-54.274
-118.25%
jan 1, 2001
-28.107
-19.73
235.52%
jan 1, 2002
83.433
+111.54
-396.84%
jan 1, 2003
124.772
+41.34
49.55%
jan 1, 2004
17.103
-107.67
-86.29%
jan 1, 2005
73.723
+56.621
331.06%
jan 1, 2006
-67.451
-141.174
-191.49%
jan 1, 2007
62.67
+130.121
-192.91%
jan 1, 2008
6.443
-56.228
-89.72%
jan 1, 2009
7.252
+0.81
12.57%
jan 1, 2010
-1.421
-8.673
-119.6%
jan 1, 2011
5.185
+6.606
-464.81%
jan 1, 2012
0.94
-4.245
-81.88%
jan 1, 2013
3.644
+2.705
287.83%
jan 1, 2014
14.424
+10.779
295.78%
jan 1, 2015
0.955
-13.469
-93.38%
jan 1, 2016
0.931
-0.025
-2.57%
Ranking of countries by current statistics by years


Comments: