29
/
en
AIzaSyAYiBZKx7MnpbEhh9jyipgxe19OcubqV5w
April 1, 2024
226822
Puerto Rico
PRI
true
2
1
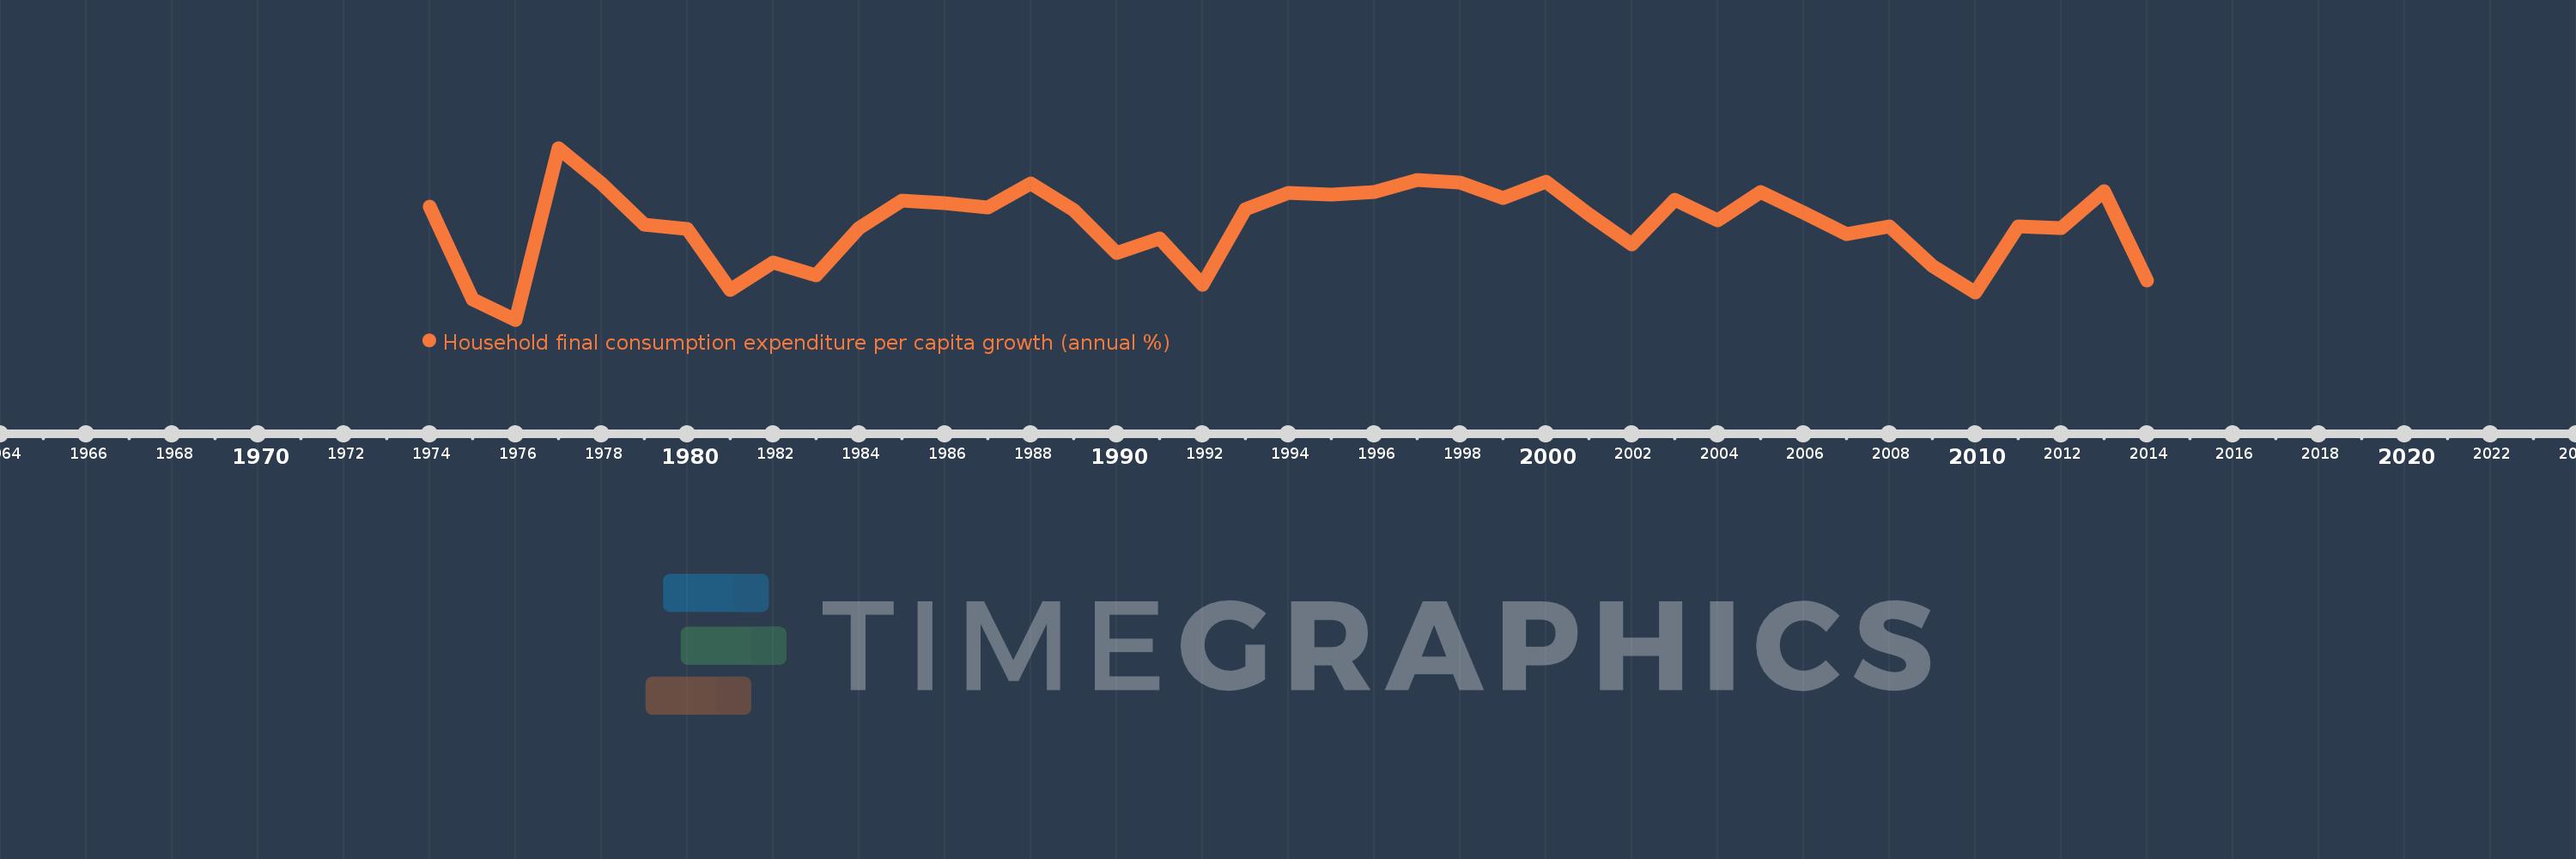
Household final consumption expenditure per capita growth (annual %)
2014,2013,2012,2011,2010,2009,2008,2007,2006,2005,2004,2003,2002,2001,2000,1999,1998,1997,1996,1995,1994,1993,1992,1991,1990,1989,1988,1987,1986,1985,1984,1983,1982,1981,1980,1979,1978,1977,1976,1975,1974
This statistics in other country:
AlbaniaAlgeriaAntigua and BarbudaArab WorldArgentinaArmeniaAustraliaAustriaAzerbaijanBahamas, TheBahrainBangladeshBarbadosBelarusBelgiumBelizeBeninBhutanBoliviaBosnia and HerzegovinaBotswanaBrazilBrunei DarussalamBulgariaBurkina FasoBurundiCabo VerdeCambodiaCameroonCanadaCaribbean small statesCentral Europe and the BalticsChadChileChinaColombiaComorosCongo, Dem. Rep.Congo, Rep.Costa RicaCote d'IvoireCroatiaCubaCyprusCzech RepublicDenmarkDominican RepublicEarly-demographic dividendEast Asia & PacificEast Asia & Pacific (excluding high income)East Asia & Pacific (IDA & IBRD countries)EcuadorEgypt, Arab Rep.El SalvadorEquatorial GuineaEritreaEstoniaEuro areaEurope & Central AsiaEurope & Central Asia (excluding high income)Europe & Central Asia (IDA & IBRD countries)European UnionFinlandFranceGabonGambia, TheGermanyGhanaGreeceGuatemalaGuineaGuinea-BissauHaitiHeavily indebted poor countries (HIPC)High incomeHondurasHong Kong SAR, ChinaHungaryIBRD onlyIcelandIDA & IBRD totalIDA blendIDA onlyIDA totalIndiaIndonesiaIran, Islamic Rep.IrelandIsraelItalyJamaicaJapanJordanKazakhstanKenyaKorea, Rep.KosovoKuwaitKyrgyz RepublicLate-demographic dividendLatin America & Caribbean Latin America & Caribbean (excluding high income)Latin America & the Caribbean (IDA & IBRD countries)LatviaLeast developed countries: UN classificationLebanonLiberiaLithuaniaLow & middle incomeLow incomeLower middle incomeLuxembourgMacao SAR, ChinaMacedonia, FYRMadagascarMalawiMalaysiaMaliMaltaMauritaniaMauritiusMexicoMiddle East & North AfricaMiddle East & North Africa (excluding high income)Middle East & North Africa (IDA & IBRD countries)Middle incomeMoldovaMongoliaMontenegroMoroccoMozambiqueNamibiaNepalNetherlandsNew ZealandNicaraguaNigerNigeriaNorth AmericaNorwayOECD membersOmanOther small statesPakistanPanamaParaguayPeruPhilippinesPolandPortugalPost-demographic dividendPre-demographic dividendPuerto RicoQatarRomaniaRussian FederationRwandaSaudi ArabiaSenegalSerbiaSierra LeoneSingaporeSlovak RepublicSloveniaSmall statesSouth AfricaSouth AsiaSouth Asia (IDA & IBRD)South SudanSpainSri LankaSub-Saharan Africa Sub-Saharan Africa (excluding high income)Sub-Saharan Africa (IDA & IBRD countries)SudanSurinameSwazilandSwedenSwitzerlandTajikistanTanzaniaThailandTimor-LesteTogoTrinidad and TobagoTunisiaTurkeyUgandaUkraineUnited Arab EmiratesUnited KingdomUnited StatesUpper middle incomeUruguayVanuatuVenezuela, RBVietnamWest Bank and GazaWorldZimbabwe Timeline:
This timeline shows a graph from 1974 to 2014 of Puerto Rico. No data until 1973. Number of actual observations by date: 41.
Source name:
World Development Indicators
Source organization:
World Bank national accounts data, and OECD National Accounts data files.
Categories, topics:
Economy & Growth
Last updated:
apr 23, 2017
Indicators value changes by year
Minimum:
-4.111
jan 1, 1976
At the date of observation
Value
Absolute change
Change from previous value
jan 1, 1974
3.258
+3.258
0.0%
jan 1, 1975
-2.803
-6.06
-186.03%
jan 1, 1976
-4.111
-1.308
46.68%
jan 1, 1977
7.055
+11.166
-271.61%
jan 1, 1978
4.734
-2.32
-32.89%
jan 1, 1979
2.094
-2.64
-55.76%
jan 1, 1980
1.807
-0.288
-13.75%
jan 1, 1981
-2.162
-3.968
-219.67%
jan 1, 1982
-0.366
+1.796
-83.07%
jan 1, 1983
-1.241
-0.875
239.22%
jan 1, 1984
1.862
+3.103
-250.01%
jan 1, 1985
3.652
+1.79
96.12%
jan 1, 1986
3.485
-0.167
-4.57%
jan 1, 1987
3.176
-0.309
-8.87%
jan 1, 1988
4.773
+1.598
50.31%
jan 1, 1989
3.011
-1.762
-36.92%
jan 1, 1990
0.212
-2.799
-92.96%
jan 1, 1991
1.15
+0.938
442.72%
jan 1, 1992
-1.866
-3.016
-262.3%
jan 1, 1993
3.076
+4.943
-264.86%
jan 1, 1994
4.112
+1.036
33.66%
jan 1, 1995
4.034
-0.078
-1.91%
jan 1, 1996
4.172
+0.139
3.44%
jan 1, 1997
4.978
+0.806
19.31%
jan 1, 1998
4.811
-0.167
-3.36%
jan 1, 1999
3.826
-0.985
-20.48%
jan 1, 2000
4.879
+1.054
27.55%
jan 1, 2001
2.756
-2.123
-43.52%
jan 1, 2002
0.784
-1.972
-71.54%
jan 1, 2003
3.698
+2.913
371.36%
jan 1, 2004
2.367
-1.33
-35.98%
jan 1, 2005
4.193
+1.826
77.11%
jan 1, 2006
2.869
-1.324
-31.58%
jan 1, 2007
1.448
-1.42
-49.51%
jan 1, 2008
1.945
+0.497
34.29%
jan 1, 2009
-0.586
-2.531
-130.12%
jan 1, 2010
-2.338
-1.752
299.11%
jan 1, 2011
1.962
+4.3
-183.92%
jan 1, 2012
1.84
-0.122
-6.21%
jan 1, 2013
4.239
+2.399
130.34%
jan 1, 2014
-1.553
-5.792
-136.63%
Ranking of countries by current statistics by years


Comments: