29
/
en
AIzaSyAYiBZKx7MnpbEhh9jyipgxe19OcubqV5w
April 1, 2024
266940
Trinidad and Tobago
TTO
true
2
1
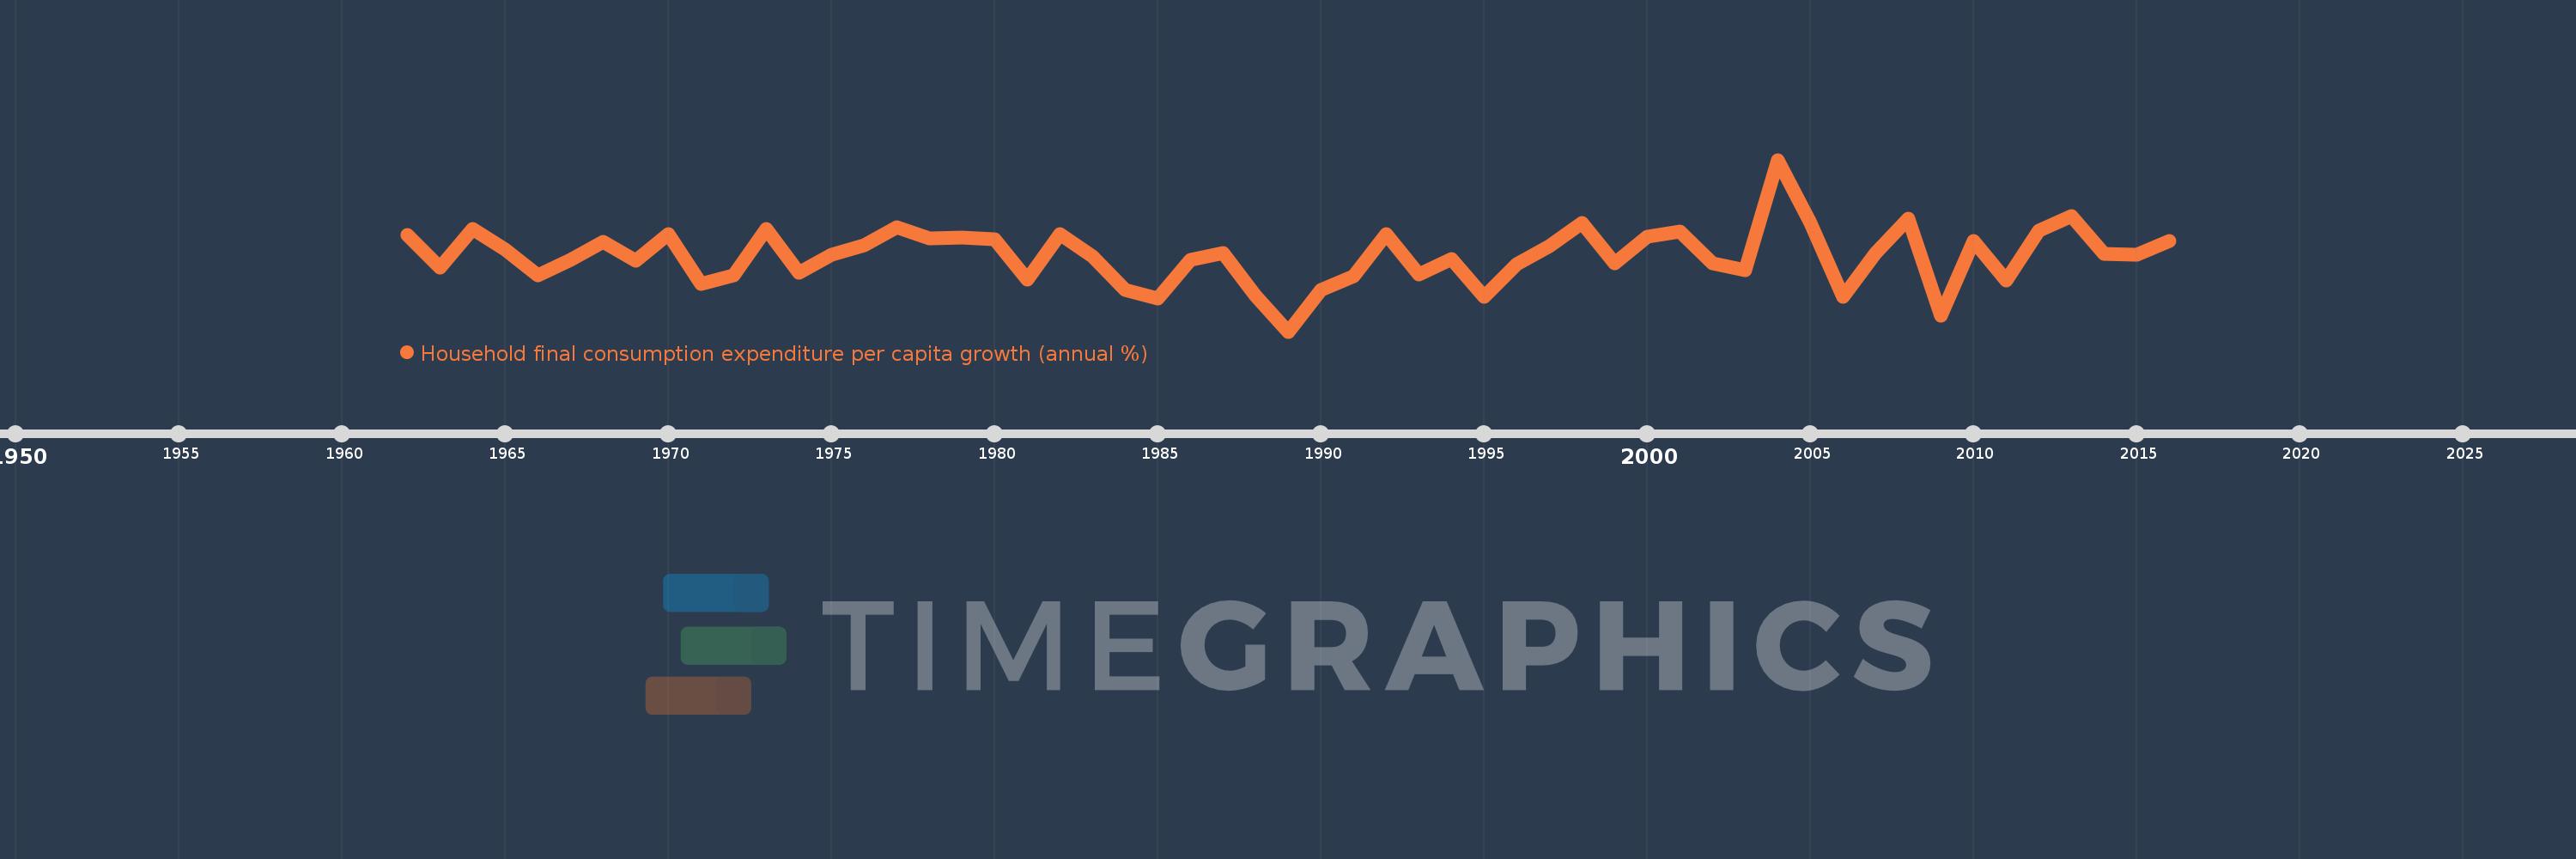
Household final consumption expenditure per capita growth (annual %)
2016,2015,2014,2013,2012,2011,2010,2009,2008,2007,2006,2005,2004,2003,2002,2001,2000,1999,1998,1997,1996,1995,1994,1993,1992,1991,1990,1989,1988,1987,1986,1985,1984,1983,1982,1981,1980,1979,1978,1977,1976,1975,1974,1973,1972,1971,1970,1969,1968,1967,1966,1965,1964,1963,1962
This statistics in other country:
AlbaniaAlgeriaAntigua and BarbudaArab WorldArgentinaArmeniaAustraliaAustriaAzerbaijanBahamas, TheBahrainBangladeshBarbadosBelarusBelgiumBelizeBeninBhutanBoliviaBosnia and HerzegovinaBotswanaBrazilBrunei DarussalamBulgariaBurkina FasoBurundiCabo VerdeCambodiaCameroonCanadaCaribbean small statesCentral Europe and the BalticsChadChileChinaColombiaComorosCongo, Dem. Rep.Congo, Rep.Costa RicaCote d'IvoireCroatiaCubaCyprusCzech RepublicDenmarkDominican RepublicEarly-demographic dividendEast Asia & PacificEast Asia & Pacific (excluding high income)East Asia & Pacific (IDA & IBRD countries)EcuadorEgypt, Arab Rep.El SalvadorEquatorial GuineaEritreaEstoniaEuro areaEurope & Central AsiaEurope & Central Asia (excluding high income)Europe & Central Asia (IDA & IBRD countries)European UnionFinlandFranceGabonGambia, TheGermanyGhanaGreeceGuatemalaGuineaGuinea-BissauHaitiHeavily indebted poor countries (HIPC)High incomeHondurasHong Kong SAR, ChinaHungaryIBRD onlyIcelandIDA & IBRD totalIDA blendIDA onlyIDA totalIndiaIndonesiaIran, Islamic Rep.IrelandIsraelItalyJamaicaJapanJordanKazakhstanKenyaKorea, Rep.KosovoKuwaitKyrgyz RepublicLate-demographic dividendLatin America & Caribbean Latin America & Caribbean (excluding high income)Latin America & the Caribbean (IDA & IBRD countries)LatviaLeast developed countries: UN classificationLebanonLiberiaLithuaniaLow & middle incomeLow incomeLower middle incomeLuxembourgMacao SAR, ChinaMacedonia, FYRMadagascarMalawiMalaysiaMaliMaltaMauritaniaMauritiusMexicoMiddle East & North AfricaMiddle East & North Africa (excluding high income)Middle East & North Africa (IDA & IBRD countries)Middle incomeMoldovaMongoliaMontenegroMoroccoMozambiqueNamibiaNepalNetherlandsNew ZealandNicaraguaNigerNigeriaNorth AmericaNorwayOECD membersOmanOther small statesPakistanPanamaParaguayPeruPhilippinesPolandPortugalPost-demographic dividendPre-demographic dividendPuerto RicoQatarRomaniaRussian FederationRwandaSaudi ArabiaSenegalSerbiaSierra LeoneSingaporeSlovak RepublicSloveniaSmall statesSouth AfricaSouth AsiaSouth Asia (IDA & IBRD)South SudanSpainSri LankaSub-Saharan Africa Sub-Saharan Africa (excluding high income)Sub-Saharan Africa (IDA & IBRD countries)SudanSurinameSwazilandSwedenSwitzerlandTajikistanTanzaniaThailandTimor-LesteTogoTrinidad and TobagoTunisiaTurkeyUgandaUkraineUnited Arab EmiratesUnited KingdomUnited StatesUpper middle incomeUruguayVanuatuVenezuela, RBVietnamWest Bank and GazaWorldZimbabwe Timeline:
This timeline shows a graph from 1962 to 2016 of Trinidad and Tobago. No data until 1961. Number of actual observations by date: 55.
Source name:
World Development Indicators
Source organization:
World Bank national accounts data, and OECD National Accounts data files.
Categories, topics:
Economy & Growth
Last updated:
apr 23, 2017
Indicators value changes by year
Minimum:
-27.471
jan 1, 1989
Maximum:
41.648
jan 1, 2004
At the date of observation
Value
Absolute change
Change from previous value
jan 1, 1962
11.53
+11.53
0.0%
jan 1, 1963
-1.83
-13.36
-115.87%
jan 1, 1964
13.904
+15.734
-859.72%
jan 1, 1965
5.558
-8.345
-60.02%
jan 1, 1966
-4.946
-10.504
-188.98%
jan 1, 1967
1.215
+6.161
-124.56%
jan 1, 1968
8.777
+7.562
622.38%
jan 1, 1969
0.997
-7.78
-88.64%
jan 1, 1970
11.869
+10.872
1.09K%
jan 1, 1971
-8.173
-20.042
-168.86%
jan 1, 1972
-4.997
+3.176
-38.86%
jan 1, 1973
13.788
+18.785
-375.92%
jan 1, 1974
-3.713
-17.501
-126.93%
jan 1, 1975
3.496
+7.21
-194.16%
jan 1, 1976
7.176
+3.68
105.25%
jan 1, 1977
14.678
+7.502
104.54%
jan 1, 1978
9.858
-4.82
-32.84%
jan 1, 1979
10.291
+0.433
4.39%
jan 1, 1980
9.542
-0.749
-7.28%
jan 1, 1981
-6.474
-16.016
-167.85%
jan 1, 1982
11.599
+18.073
-279.17%
jan 1, 1983
2.907
-8.692
-74.94%
jan 1, 1984
-10.587
-13.494
-464.2%
jan 1, 1985
-14.288
-3.7
34.95%
jan 1, 1986
1.47
+15.758
-110.29%
jan 1, 1987
4.102
+2.632
179.0%
jan 1, 1988
-13.003
-17.105
-417.0%
jan 1, 1989
-27.471
-14.468
111.26%
jan 1, 1990
-10.874
+16.597
-60.42%
jan 1, 1991
-5.07
+5.804
-53.37%
jan 1, 1992
11.841
+16.911
-333.56%
jan 1, 1993
-4.493
-16.334
-137.94%
jan 1, 1994
1.719
+6.212
-138.27%
jan 1, 1995
-13.351
-15.07
-876.54%
jan 1, 1996
-0.26
+13.091
-98.05%
jan 1, 1997
6.884
+7.144
-2.75K%
jan 1, 1998
16.393
+9.509
138.14%
jan 1, 1999
0.028
-16.365
-99.83%
jan 1, 2000
10.586
+10.558
37.98K%
jan 1, 2001
12.653
+2.067
19.53%
jan 1, 2002
0.119
-12.534
-99.06%
jan 1, 2003
-2.906
-3.025
-2.55K%
jan 1, 2004
41.648
+44.554
-1.53K%
jan 1, 2005
16.375
-25.273
-60.68%
jan 1, 2006
-13.62
-29.995
-183.17%
jan 1, 2007
4.17
+17.789
-130.61%
jan 1, 2008
18.015
+13.845
332.06%
jan 1, 2009
-21.069
-39.084
-216.95%
jan 1, 2010
8.952
+30.021
-142.49%
jan 1, 2011
-6.921
-15.873
-177.31%
jan 1, 2012
13.238
+20.159
-291.28%
jan 1, 2013
19.036
+5.798
43.8%
jan 1, 2014
3.703
-15.334
-80.55%
jan 1, 2015
3.416
-0.287
-7.75%
jan 1, 2016
9.115
+5.699
166.86%
Ranking of countries by current statistics by years


Comments: