29
/
en
AIzaSyAYiBZKx7MnpbEhh9jyipgxe19OcubqV5w
April 1, 2024
75943
Bahamas, The
BHS
true
2
1
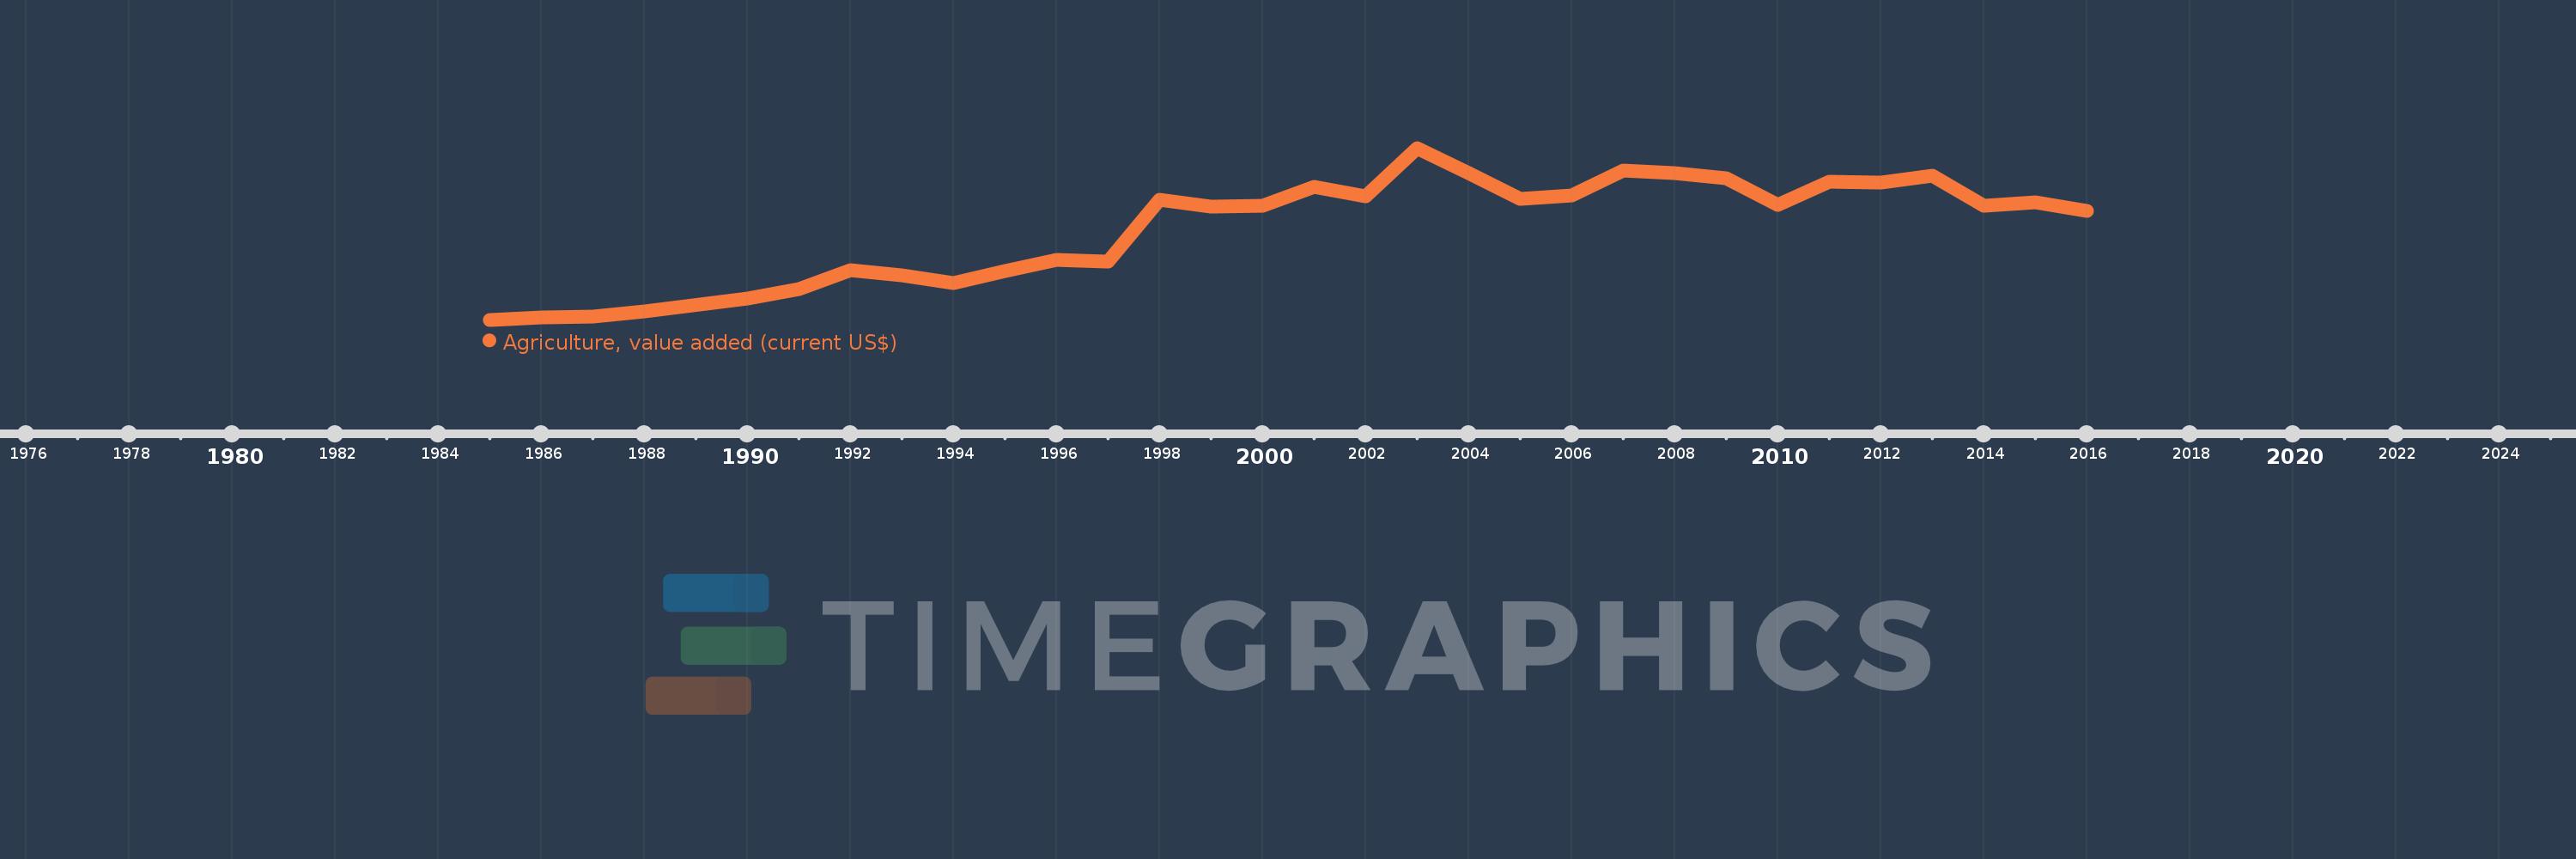
Agriculture, value added (current US$)
2016,2015,2014,2013,2012,2011,2010,2009,2008,2007,2006,2005,2004,2003,2002,2001,2000,1999,1998,1997,1996,1995,1994,1993,1992,1991,1990,1988,1987,1986,1985
This statistics in other country:
AfghanistanAlbaniaAlgeriaAndorraAngolaAntigua and BarbudaArab WorldArgentinaArmeniaArubaAustraliaAustriaAzerbaijanBahamas, TheBahrainBangladeshBarbadosBelarusBelgiumBelizeBeninBermudaBhutanBoliviaBosnia and HerzegovinaBotswanaBrazilBrunei DarussalamBulgariaBurkina FasoBurundiCabo VerdeCambodiaCameroonCanadaCaribbean small statesCayman IslandsCentral African RepublicCentral Europe and the BalticsChadChileChinaColombiaComorosCongo, Dem. Rep.Congo, Rep.Costa RicaCote d'IvoireCroatiaCubaCyprusCzech RepublicDenmarkDjiboutiDominicaDominican RepublicEarly-demographic dividendEast Asia & PacificEast Asia & Pacific (excluding high income)East Asia & Pacific (IDA & IBRD countries)EcuadorEgypt, Arab Rep.El SalvadorEquatorial GuineaEritreaEstoniaEthiopiaEuro areaEurope & Central AsiaEurope & Central Asia (excluding high income)Europe & Central Asia (IDA & IBRD countries)European UnionFijiFinlandFragile and conflict affected situationsFranceFrench PolynesiaGabonGambia, TheGeorgiaGermanyGhanaGreeceGrenadaGuatemalaGuineaGuinea-BissauGuyanaHeavily indebted poor countries (HIPC)High incomeHondurasHong Kong SAR, ChinaHungaryIBRD onlyIcelandIDA & IBRD totalIDA blendIDA onlyIDA totalIndiaIndonesiaIran, Islamic Rep.IraqIrelandItalyJamaicaJapanJordanKazakhstanKenyaKiribatiKorea, Rep.KosovoKuwaitKyrgyz RepublicLao PDRLate-demographic dividendLatin America & Caribbean Latin America & Caribbean (excluding high income)Latin America & the Caribbean (IDA & IBRD countries)LatviaLeast developed countries: UN classificationLebanonLesothoLiberiaLibyaLithuaniaLow & middle incomeLow incomeLower middle incomeLuxembourgMacao SAR, ChinaMacedonia, FYRMadagascarMalawiMalaysiaMaldivesMaliMaltaMarshall IslandsMauritaniaMauritiusMexicoMicronesia, Fed. Sts.Middle East & North AfricaMiddle East & North Africa (excluding high income)Middle East & North Africa (IDA & IBRD countries)Middle incomeMoldovaMongoliaMontenegroMoroccoMozambiqueMyanmarNamibiaNepalNetherlandsNew CaledoniaNew ZealandNicaraguaNigerNigeriaNorth AmericaNorwayOECD membersOmanOther small statesPakistanPalauPanamaPapua New GuineaParaguayPeruPhilippinesPolandPortugalPost-demographic dividendPre-demographic dividendPuerto RicoQatarRomaniaRussian FederationRwandaSamoaSao Tome and PrincipeSaudi ArabiaSenegalSerbiaSeychellesSierra LeoneSingaporeSlovak RepublicSloveniaSmall statesSolomon IslandsSouth AfricaSouth AsiaSouth Asia (IDA & IBRD)SpainSri LankaSt. Kitts and NevisSt. LuciaSt. Vincent and the GrenadinesSub-Saharan Africa Sub-Saharan Africa (excluding high income)Sub-Saharan Africa (IDA & IBRD countries)SudanSurinameSwazilandSwedenSwitzerlandSyrian Arab RepublicTajikistanTanzaniaThailandTimor-LesteTogoTongaTrinidad and TobagoTunisiaTurkeyTurkmenistanTuvaluUgandaUkraineUnited Arab EmiratesUnited KingdomUnited StatesUpper middle incomeUruguayUzbekistanVanuatuVenezuela, RBVietnamWest Bank and GazaWorldYemen, Rep.ZambiaZimbabwe Timeline:
This timeline shows a graph from 1985 to 2016 of Bahamas, The. No data until 1984. Number of actual observations by date: 31.
Source name:
World Development Indicators
Source organization:
World Bank national accounts data, and OECD National Accounts data files.
Categories, topics:
Agriculture & Rural Development, Economy & Growth
Last updated:
apr 23, 2017
Indicators value changes by year
Minimum:
41.7 mln
jan 1, 1985
Maximum:
201.861 mln
jan 1, 2003
At the date of observation
Value
Absolute change
Change from previous value
jan 1, 1985
41.7 mln
+41.7 mln
0.0%
jan 1, 1986
44.2 mln
+2.5 mln
6.0%
jan 1, 1987
44.8 mln
+600.0K
1.36%
jan 1, 1988
49.6 mln
+4.8 mln
10.71%
jan 1, 1990
61.623 mln
+12.023 mln
24.24%
jan 1, 1991
69.922 mln
+8.299 mln
13.47%
jan 1, 1992
88.162 mln
+18.24 mln
26.09%
jan 1, 1993
82.793 mln
-5.369 mln
-6.09%
jan 1, 1994
76.103 mln
-6.69 mln
-8.08%
jan 1, 1995
87.181 mln
+11.078 mln
14.56%
jan 1, 1996
97.183 mln
+10.002 mln
11.47%
jan 1, 1997
95.527 mln
-1.656 mln
-1.7%
jan 1, 1998
153.765 mln
+58.238 mln
60.96%
jan 1, 1999
147.122 mln
-6.643 mln
-4.32%
jan 1, 2000
147.948 mln
+826.0K
0.56%
jan 1, 2001
165.671 mln
+17.723 mln
11.98%
jan 1, 2002
157.082 mln
-8.589 mln
-5.18%
jan 1, 2003
201.861 mln
+44.779 mln
28.51%
jan 1, 2004
178.023 mln
-23.838 mln
-11.81%
jan 1, 2005
154.327 mln
-23.696 mln
-13.31%
jan 1, 2006
157.768 mln
+3.441 mln
2.23%
jan 1, 2007
180.451 mln
+22.683 mln
14.38%
jan 1, 2008
178.422 mln
-2.029 mln
-1.12%
jan 1, 2009
173.387 mln
-5.035 mln
-2.82%
jan 1, 2010
148.876 mln
-24.511 mln
-14.14%
jan 1, 2011
170.017 mln
+21.141 mln
14.2%
jan 1, 2012
169.592 mln
-425.0K
-0.25%
jan 1, 2013
176.221 mln
+6.629 mln
3.91%
jan 1, 2014
148.018 mln
-28.203 mln
-16.0%
jan 1, 2015
151.382 mln
+3.364 mln
2.27%
jan 1, 2016
143.306 mln
-8.076 mln
-5.33%
Ranking of countries by current statistics by years


Comments: