29
/
en
AIzaSyAYiBZKx7MnpbEhh9jyipgxe19OcubqV5w
April 1, 2024
108245
Comoros
COM
true
2
1
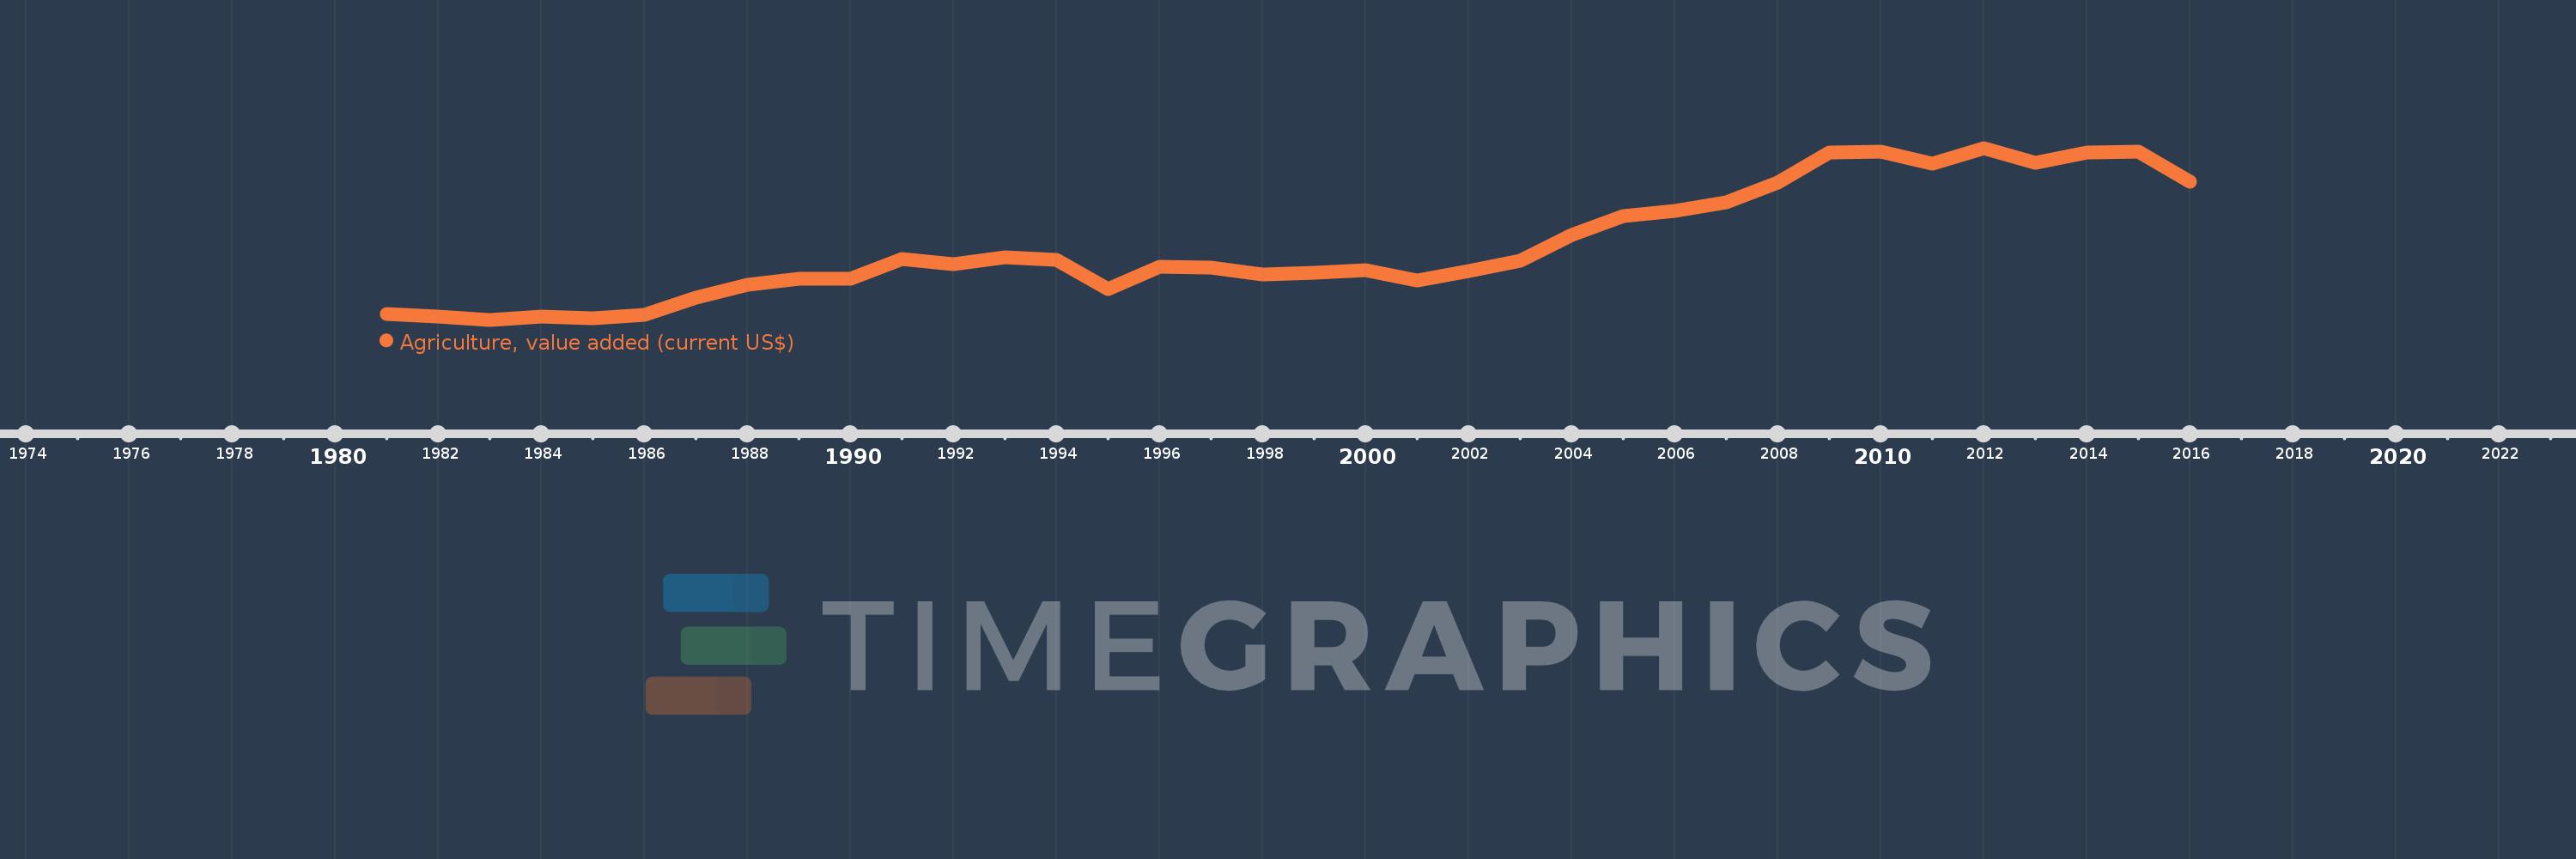
Agriculture, value added (current US$)
2016,2015,2014,2013,2012,2011,2010,2009,2008,2007,2006,2005,2004,2003,2002,2001,2000,1999,1998,1997,1996,1995,1994,1993,1992,1991,1990,1989,1988,1987,1986,1985,1984,1983,1982,1981
This statistics in other country:
AfghanistanAlbaniaAlgeriaAndorraAngolaAntigua and BarbudaArab WorldArgentinaArmeniaArubaAustraliaAustriaAzerbaijanBahamas, TheBahrainBangladeshBarbadosBelarusBelgiumBelizeBeninBermudaBhutanBoliviaBosnia and HerzegovinaBotswanaBrazilBrunei DarussalamBulgariaBurkina FasoBurundiCabo VerdeCambodiaCameroonCanadaCaribbean small statesCayman IslandsCentral African RepublicCentral Europe and the BalticsChadChileChinaColombiaComorosCongo, Dem. Rep.Congo, Rep.Costa RicaCote d'IvoireCroatiaCubaCyprusCzech RepublicDenmarkDjiboutiDominicaDominican RepublicEarly-demographic dividendEast Asia & PacificEast Asia & Pacific (excluding high income)East Asia & Pacific (IDA & IBRD countries)EcuadorEgypt, Arab Rep.El SalvadorEquatorial GuineaEritreaEstoniaEthiopiaEuro areaEurope & Central AsiaEurope & Central Asia (excluding high income)Europe & Central Asia (IDA & IBRD countries)European UnionFijiFinlandFragile and conflict affected situationsFranceFrench PolynesiaGabonGambia, TheGeorgiaGermanyGhanaGreeceGrenadaGuatemalaGuineaGuinea-BissauGuyanaHeavily indebted poor countries (HIPC)High incomeHondurasHong Kong SAR, ChinaHungaryIBRD onlyIcelandIDA & IBRD totalIDA blendIDA onlyIDA totalIndiaIndonesiaIran, Islamic Rep.IraqIrelandItalyJamaicaJapanJordanKazakhstanKenyaKiribatiKorea, Rep.KosovoKuwaitKyrgyz RepublicLao PDRLate-demographic dividendLatin America & Caribbean Latin America & Caribbean (excluding high income)Latin America & the Caribbean (IDA & IBRD countries)LatviaLeast developed countries: UN classificationLebanonLesothoLiberiaLibyaLithuaniaLow & middle incomeLow incomeLower middle incomeLuxembourgMacao SAR, ChinaMacedonia, FYRMadagascarMalawiMalaysiaMaldivesMaliMaltaMarshall IslandsMauritaniaMauritiusMexicoMicronesia, Fed. Sts.Middle East & North AfricaMiddle East & North Africa (excluding high income)Middle East & North Africa (IDA & IBRD countries)Middle incomeMoldovaMongoliaMontenegroMoroccoMozambiqueMyanmarNamibiaNepalNetherlandsNew CaledoniaNew ZealandNicaraguaNigerNigeriaNorth AmericaNorwayOECD membersOmanOther small statesPakistanPalauPanamaPapua New GuineaParaguayPeruPhilippinesPolandPortugalPost-demographic dividendPre-demographic dividendPuerto RicoQatarRomaniaRussian FederationRwandaSamoaSao Tome and PrincipeSaudi ArabiaSenegalSerbiaSeychellesSierra LeoneSingaporeSlovak RepublicSloveniaSmall statesSolomon IslandsSouth AfricaSouth AsiaSouth Asia (IDA & IBRD)SpainSri LankaSt. Kitts and NevisSt. LuciaSt. Vincent and the GrenadinesSub-Saharan Africa Sub-Saharan Africa (excluding high income)Sub-Saharan Africa (IDA & IBRD countries)SudanSurinameSwazilandSwedenSwitzerlandSyrian Arab RepublicTajikistanTanzaniaThailandTimor-LesteTogoTongaTrinidad and TobagoTunisiaTurkeyTurkmenistanTuvaluUgandaUkraineUnited Arab EmiratesUnited KingdomUnited StatesUpper middle incomeUruguayUzbekistanVanuatuVenezuela, RBVietnamWest Bank and GazaWorldYemen, Rep.ZambiaZimbabwe Timeline:
This timeline shows a graph from 1981 to 2016 of Comoros. No data until 1980. Number of actual observations by date: 36.
Source name:
World Development Indicators
Source organization:
World Bank national accounts data, and OECD National Accounts data files.
Categories, topics:
Agriculture & Rural Development, Economy & Growth
Last updated:
apr 23, 2017
Indicators value changes by year
Minimum:
35.852 mln
jan 1, 1983
Maximum:
227.401 mln
jan 1, 2012
At the date of observation
Value
Absolute change
Change from previous value
jan 1, 1981
42.006 mln
+42.006 mln
0.0%
jan 1, 1982
39.079 mln
-2.927 mln
-6.97%
jan 1, 1983
35.852 mln
-3.228 mln
-8.26%
jan 1, 1984
38.999 mln
+3.147 mln
8.78%
jan 1, 1985
37.226 mln
-1.773 mln
-4.55%
jan 1, 1986
41.35 mln
+4.124 mln
11.08%
jan 1, 1987
60.782 mln
+19.432 mln
46.99%
jan 1, 1988
74.594 mln
+13.812 mln
22.72%
jan 1, 1989
81.888 mln
+7.294 mln
9.78%
jan 1, 1990
81.262 mln
-626.143K
-0.76%
jan 1, 1991
103.565 mln
+22.304 mln
27.45%
jan 1, 1992
97.886 mln
-5.68 mln
-5.48%
jan 1, 1993
105.172 mln
+7.287 mln
7.44%
jan 1, 1994
103.083 mln
-2.089 mln
-1.99%
jan 1, 1995
69.878 mln
-33.205 mln
-32.21%
jan 1, 1996
94.827 mln
+24.949 mln
35.7%
jan 1, 1997
94.253 mln
-573.847K
-0.61%
jan 1, 1998
86.735 mln
-7.518 mln
-7.98%
jan 1, 1999
88.16 mln
+1.425 mln
1.64%
jan 1, 2000
91.146 mln
+2.987 mln
3.39%
jan 1, 2001
79.289 mln
-11.858 mln
-13.01%
jan 1, 2002
90.0 mln
+10.711 mln
13.51%
jan 1, 2003
101.389 mln
+11.389 mln
12.65%
jan 1, 2004
130.492 mln
+29.104 mln
28.71%
jan 1, 2005
151.264 mln
+20.772 mln
15.92%
jan 1, 2006
156.807 mln
+5.543 mln
3.66%
jan 1, 2007
166.393 mln
+9.586 mln
6.11%
jan 1, 2008
188.827 mln
+22.434 mln
13.48%
jan 1, 2009
222.665 mln
+33.838 mln
17.92%
jan 1, 2010
223.259 mln
+594.087K
0.27%
jan 1, 2011
209.938 mln
-13.322 mln
-5.97%
jan 1, 2012
227.401 mln
+17.463 mln
8.32%
jan 1, 2013
210.467 mln
-16.933 mln
-7.45%
jan 1, 2014
222.077 mln
+11.61 mln
5.52%
jan 1, 2015
223.634 mln
+1.557 mln
0.7%
jan 1, 2016
189.979 mln
-33.655 mln
-15.05%
Ranking of countries by current statistics by years


Comments: