29
/
en
AIzaSyAYiBZKx7MnpbEhh9jyipgxe19OcubqV5w
April 1, 2024
95781
Burundi
BDI
true
2
1
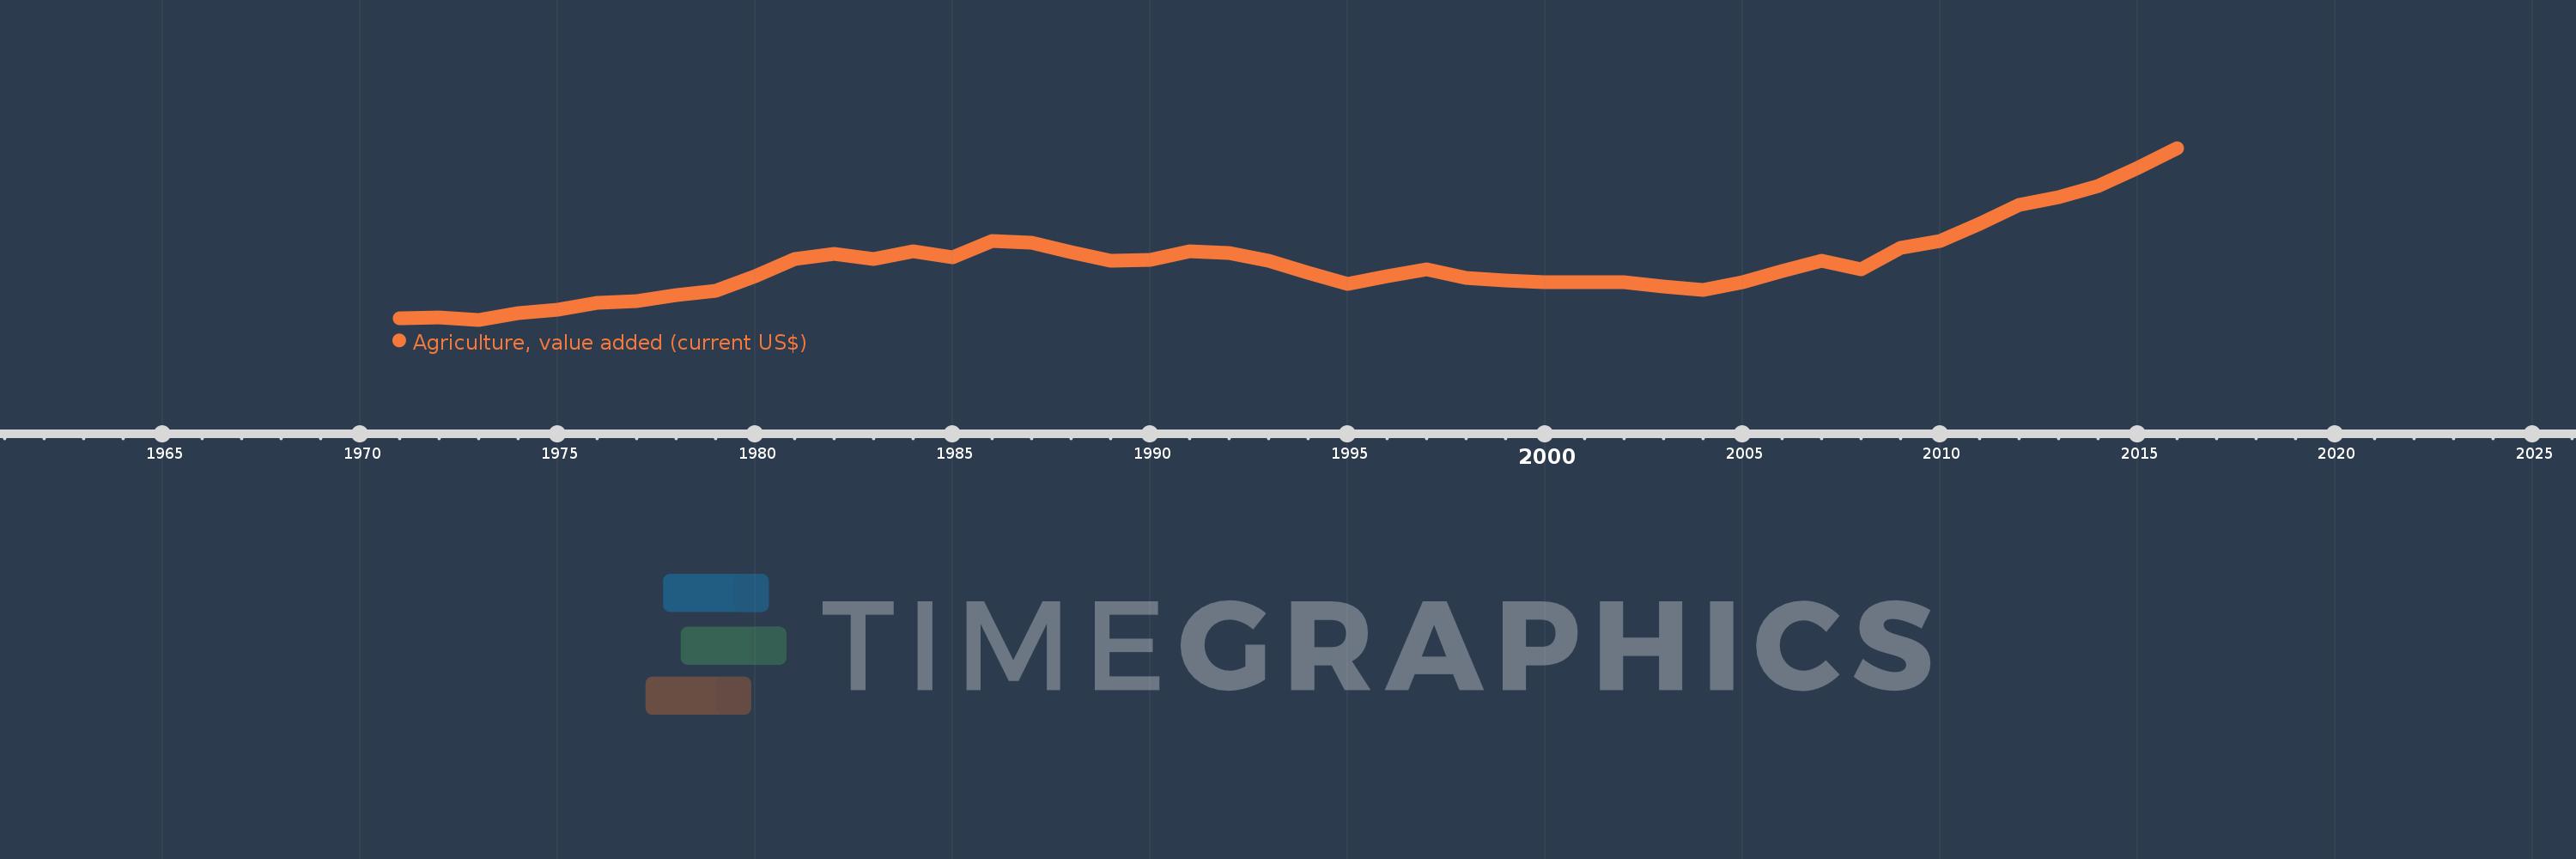
Agriculture, value added (current US$)
2016,2015,2014,2013,2012,2011,2010,2009,2008,2007,2006,2005,2004,2003,2002,2001,2000,1999,1998,1997,1996,1995,1994,1993,1992,1991,1990,1989,1988,1987,1986,1985,1984,1983,1982,1981,1980,1979,1978,1977,1976,1975,1974,1973,1972,1971
This statistics in other country:
AfghanistanAlbaniaAlgeriaAndorraAngolaAntigua and BarbudaArab WorldArgentinaArmeniaArubaAustraliaAustriaAzerbaijanBahamas, TheBahrainBangladeshBarbadosBelarusBelgiumBelizeBeninBermudaBhutanBoliviaBosnia and HerzegovinaBotswanaBrazilBrunei DarussalamBulgariaBurkina FasoBurundiCabo VerdeCambodiaCameroonCanadaCaribbean small statesCayman IslandsCentral African RepublicCentral Europe and the BalticsChadChileChinaColombiaComorosCongo, Dem. Rep.Congo, Rep.Costa RicaCote d'IvoireCroatiaCubaCyprusCzech RepublicDenmarkDjiboutiDominicaDominican RepublicEarly-demographic dividendEast Asia & PacificEast Asia & Pacific (excluding high income)East Asia & Pacific (IDA & IBRD countries)EcuadorEgypt, Arab Rep.El SalvadorEquatorial GuineaEritreaEstoniaEthiopiaEuro areaEurope & Central AsiaEurope & Central Asia (excluding high income)Europe & Central Asia (IDA & IBRD countries)European UnionFijiFinlandFragile and conflict affected situationsFranceFrench PolynesiaGabonGambia, TheGeorgiaGermanyGhanaGreeceGrenadaGuatemalaGuineaGuinea-BissauGuyanaHeavily indebted poor countries (HIPC)High incomeHondurasHong Kong SAR, ChinaHungaryIBRD onlyIcelandIDA & IBRD totalIDA blendIDA onlyIDA totalIndiaIndonesiaIran, Islamic Rep.IraqIrelandItalyJamaicaJapanJordanKazakhstanKenyaKiribatiKorea, Rep.KosovoKuwaitKyrgyz RepublicLao PDRLate-demographic dividendLatin America & Caribbean Latin America & Caribbean (excluding high income)Latin America & the Caribbean (IDA & IBRD countries)LatviaLeast developed countries: UN classificationLebanonLesothoLiberiaLibyaLithuaniaLow & middle incomeLow incomeLower middle incomeLuxembourgMacao SAR, ChinaMacedonia, FYRMadagascarMalawiMalaysiaMaldivesMaliMaltaMarshall IslandsMauritaniaMauritiusMexicoMicronesia, Fed. Sts.Middle East & North AfricaMiddle East & North Africa (excluding high income)Middle East & North Africa (IDA & IBRD countries)Middle incomeMoldovaMongoliaMontenegroMoroccoMozambiqueMyanmarNamibiaNepalNetherlandsNew CaledoniaNew ZealandNicaraguaNigerNigeriaNorth AmericaNorwayOECD membersOmanOther small statesPakistanPalauPanamaPapua New GuineaParaguayPeruPhilippinesPolandPortugalPost-demographic dividendPre-demographic dividendPuerto RicoQatarRomaniaRussian FederationRwandaSamoaSao Tome and PrincipeSaudi ArabiaSenegalSerbiaSeychellesSierra LeoneSingaporeSlovak RepublicSloveniaSmall statesSolomon IslandsSouth AfricaSouth AsiaSouth Asia (IDA & IBRD)SpainSri LankaSt. Kitts and NevisSt. LuciaSt. Vincent and the GrenadinesSub-Saharan Africa Sub-Saharan Africa (excluding high income)Sub-Saharan Africa (IDA & IBRD countries)SudanSurinameSwazilandSwedenSwitzerlandSyrian Arab RepublicTajikistanTanzaniaThailandTimor-LesteTogoTongaTrinidad and TobagoTunisiaTurkeyTurkmenistanTuvaluUgandaUkraineUnited Arab EmiratesUnited KingdomUnited StatesUpper middle incomeUruguayUzbekistanVanuatuVenezuela, RBVietnamWest Bank and GazaWorldYemen, Rep.ZambiaZimbabwe Timeline:
This timeline shows a graph from 1971 to 2016 of Burundi. No data until 1970. Number of actual observations by date: 46.
Source name:
World Development Indicators
Source organization:
World Bank national accounts data, and OECD National Accounts data files.
Categories, topics:
Agriculture & Rural Development, Economy & Growth
Last updated:
apr 23, 2017
Indicators value changes by year
Minimum:
149.991 mln
jan 1, 1973
Maximum:
1.227 bln
jan 1, 2016
At the date of observation
Value
Absolute change
Change from previous value
jan 1, 1971
158.581 mln
+158.581 mln
0.0%
jan 1, 1972
163.745 mln
+5.165 mln
3.26%
jan 1, 1973
149.991 mln
-13.754 mln
-8.4%
jan 1, 1974
192.689 mln
+42.698 mln
28.47%
jan 1, 1975
210.729 mln
+18.04 mln
9.36%
jan 1, 1976
258.08 mln
+47.351 mln
22.47%
jan 1, 1977
266.696 mln
+8.616 mln
3.34%
jan 1, 1978
304.321 mln
+37.625 mln
14.11%
jan 1, 1979
329.302 mln
+24.981 mln
8.21%
jan 1, 1980
421.236 mln
+91.933 mln
27.92%
jan 1, 1981
529.504 mln
+108.269 mln
25.7%
jan 1, 1982
563.429 mln
+33.924 mln
6.41%
jan 1, 1983
533.083 mln
-30.346 mln
-5.39%
jan 1, 1984
579.173 mln
+46.089 mln
8.65%
jan 1, 1985
539.571 mln
-39.601 mln
-6.84%
jan 1, 1986
643.436 mln
+103.865 mln
19.25%
jan 1, 1987
631.141 mln
-12.295 mln
-1.91%
jan 1, 1988
572.028 mln
-59.113 mln
-9.37%
jan 1, 1989
521.888 mln
-50.141 mln
-8.77%
jan 1, 1990
524.904 mln
+3.017 mln
0.58%
jan 1, 1991
578.015 mln
+53.111 mln
10.12%
jan 1, 1992
567.331 mln
-10.684 mln
-1.85%
jan 1, 1993
519.907 mln
-47.424 mln
-8.36%
jan 1, 1994
442.751 mln
-77.156 mln
-14.84%
jan 1, 1995
376.786 mln
-65.965 mln
-14.9%
jan 1, 1996
420.407 mln
+43.62 mln
11.58%
jan 1, 1997
463.898 mln
+43.491 mln
10.35%
jan 1, 1998
412.721 mln
-51.178 mln
-11.03%
jan 1, 1999
398.074 mln
-14.647 mln
-3.55%
jan 1, 2000
384.93 mln
-13.144 mln
-3.3%
jan 1, 2001
383.946 mln
-984.405K
-0.26%
jan 1, 2002
384.414 mln
+468.718K
0.12%
jan 1, 2003
357.673 mln
-26.741 mln
-6.96%
jan 1, 2004
336.156 mln
-21.517 mln
-6.02%
jan 1, 2005
383.517 mln
+47.361 mln
14.09%
jan 1, 2006
456.371 mln
+72.854 mln
19.0%
jan 1, 2007
517.457 mln
+61.087 mln
13.39%
jan 1, 2008
465.86 mln
-51.597 mln
-9.97%
jan 1, 2009
600.156 mln
+134.296 mln
28.83%
jan 1, 2010
643.656 mln
+43.499 mln
7.25%
jan 1, 2011
749.309 mln
+105.653 mln
16.41%
jan 1, 2012
869.277 mln
+119.968 mln
16.01%
jan 1, 2013
916.497 mln
+47.22 mln
5.43%
jan 1, 2014
985.727 mln
+69.23 mln
7.55%
jan 1, 2015
1.104 bln
+117.78 mln
11.95%
jan 1, 2016
1.227 bln
+123.252 mln
11.17%
Ranking of countries by current statistics by years


Comments: