29
/
en
AIzaSyAYiBZKx7MnpbEhh9jyipgxe19OcubqV5w
April 1, 2024
111861
Costa Rica
CRI
true
2
1
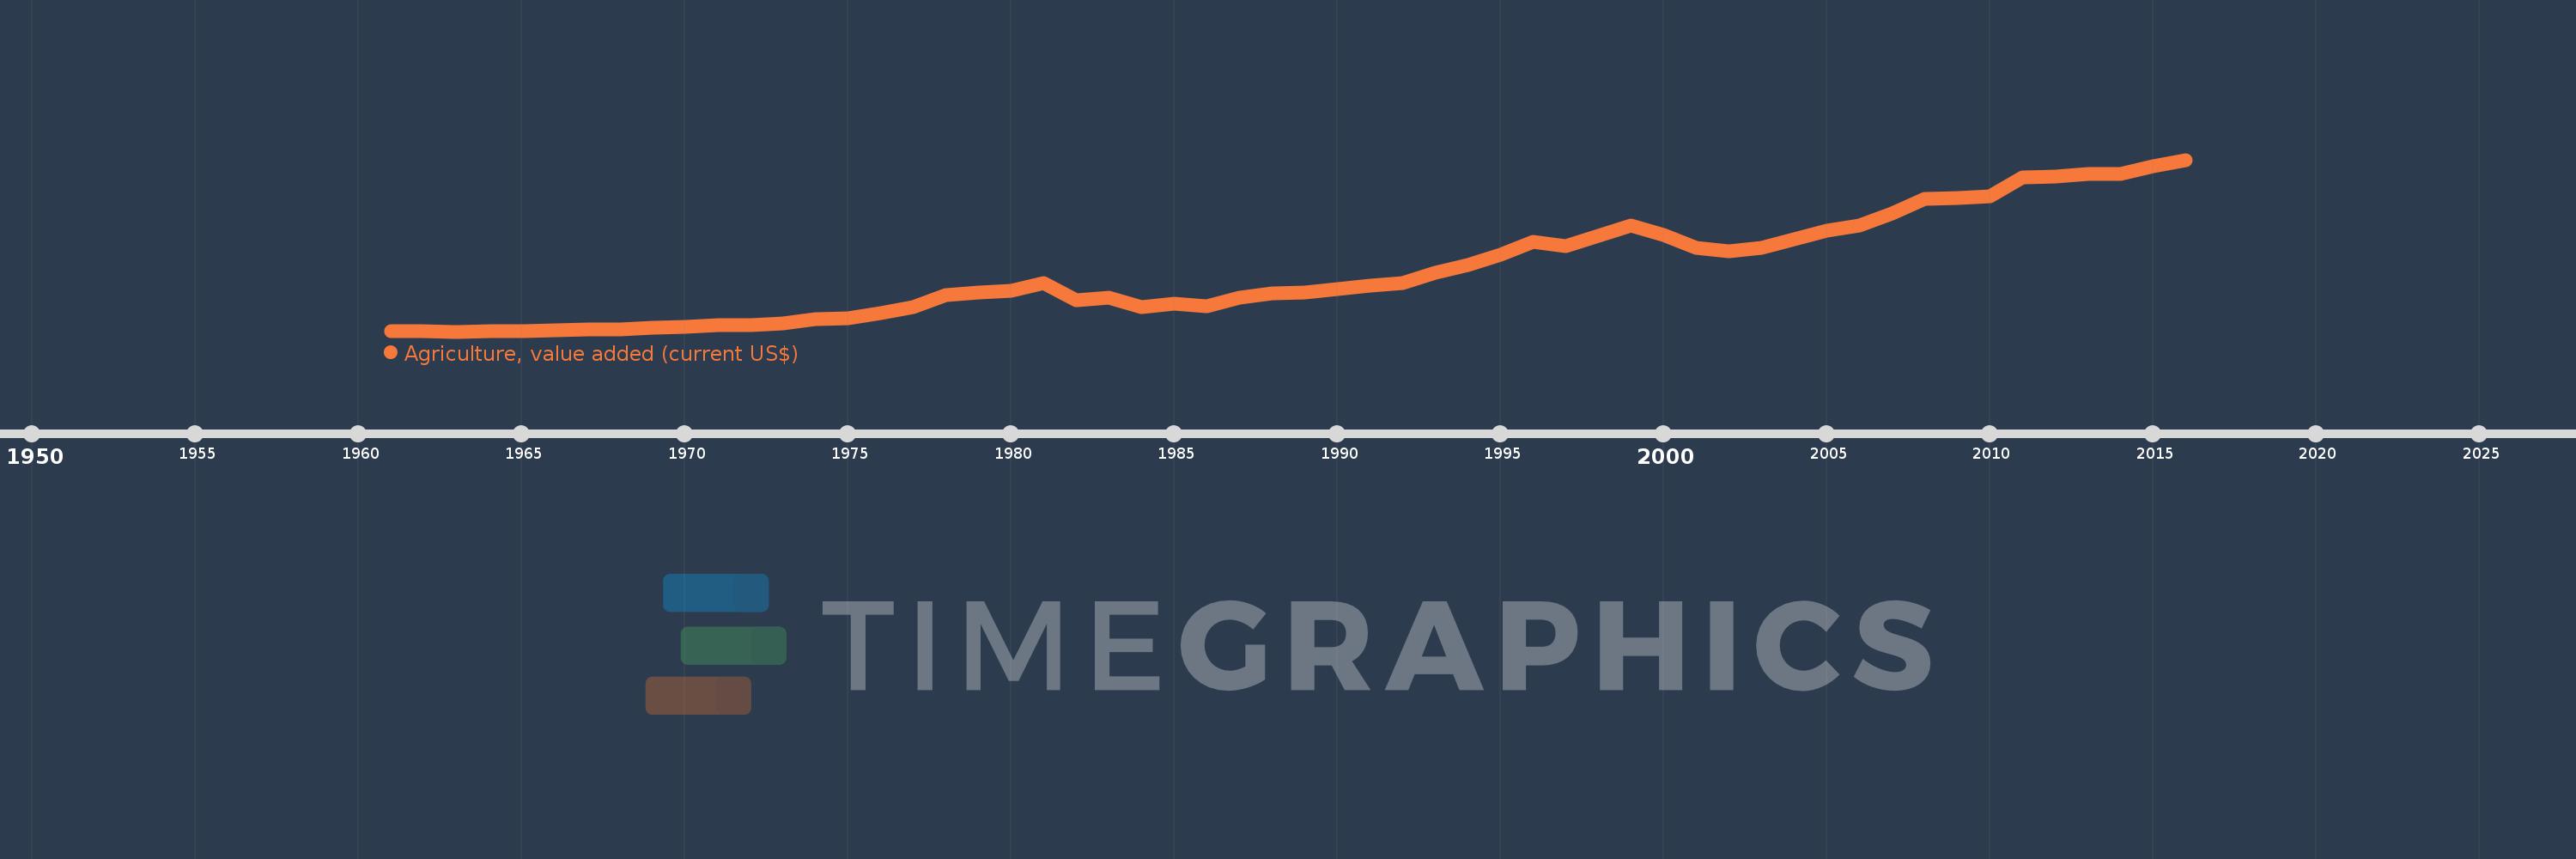
Agriculture, value added (current US$)
2016,2015,2014,2013,2012,2011,2010,2009,2008,2007,2006,2005,2004,2003,2002,2001,2000,1999,1998,1997,1996,1995,1994,1993,1992,1991,1990,1989,1988,1987,1986,1985,1984,1983,1982,1981,1980,1979,1978,1977,1976,1975,1974,1973,1972,1971,1970,1969,1968,1967,1966,1965,1964,1963,1962,1961
This statistics in other country:
AfghanistanAlbaniaAlgeriaAndorraAngolaAntigua and BarbudaArab WorldArgentinaArmeniaArubaAustraliaAustriaAzerbaijanBahamas, TheBahrainBangladeshBarbadosBelarusBelgiumBelizeBeninBermudaBhutanBoliviaBosnia and HerzegovinaBotswanaBrazilBrunei DarussalamBulgariaBurkina FasoBurundiCabo VerdeCambodiaCameroonCanadaCaribbean small statesCayman IslandsCentral African RepublicCentral Europe and the BalticsChadChileChinaColombiaComorosCongo, Dem. Rep.Congo, Rep.Costa RicaCote d'IvoireCroatiaCubaCyprusCzech RepublicDenmarkDjiboutiDominicaDominican RepublicEarly-demographic dividendEast Asia & PacificEast Asia & Pacific (excluding high income)East Asia & Pacific (IDA & IBRD countries)EcuadorEgypt, Arab Rep.El SalvadorEquatorial GuineaEritreaEstoniaEthiopiaEuro areaEurope & Central AsiaEurope & Central Asia (excluding high income)Europe & Central Asia (IDA & IBRD countries)European UnionFijiFinlandFragile and conflict affected situationsFranceFrench PolynesiaGabonGambia, TheGeorgiaGermanyGhanaGreeceGrenadaGuatemalaGuineaGuinea-BissauGuyanaHeavily indebted poor countries (HIPC)High incomeHondurasHong Kong SAR, ChinaHungaryIBRD onlyIcelandIDA & IBRD totalIDA blendIDA onlyIDA totalIndiaIndonesiaIran, Islamic Rep.IraqIrelandItalyJamaicaJapanJordanKazakhstanKenyaKiribatiKorea, Rep.KosovoKuwaitKyrgyz RepublicLao PDRLate-demographic dividendLatin America & Caribbean Latin America & Caribbean (excluding high income)Latin America & the Caribbean (IDA & IBRD countries)LatviaLeast developed countries: UN classificationLebanonLesothoLiberiaLibyaLithuaniaLow & middle incomeLow incomeLower middle incomeLuxembourgMacao SAR, ChinaMacedonia, FYRMadagascarMalawiMalaysiaMaldivesMaliMaltaMarshall IslandsMauritaniaMauritiusMexicoMicronesia, Fed. Sts.Middle East & North AfricaMiddle East & North Africa (excluding high income)Middle East & North Africa (IDA & IBRD countries)Middle incomeMoldovaMongoliaMontenegroMoroccoMozambiqueMyanmarNamibiaNepalNetherlandsNew CaledoniaNew ZealandNicaraguaNigerNigeriaNorth AmericaNorwayOECD membersOmanOther small statesPakistanPalauPanamaPapua New GuineaParaguayPeruPhilippinesPolandPortugalPost-demographic dividendPre-demographic dividendPuerto RicoQatarRomaniaRussian FederationRwandaSamoaSao Tome and PrincipeSaudi ArabiaSenegalSerbiaSeychellesSierra LeoneSingaporeSlovak RepublicSloveniaSmall statesSolomon IslandsSouth AfricaSouth AsiaSouth Asia (IDA & IBRD)SpainSri LankaSt. Kitts and NevisSt. LuciaSt. Vincent and the GrenadinesSub-Saharan Africa Sub-Saharan Africa (excluding high income)Sub-Saharan Africa (IDA & IBRD countries)SudanSurinameSwazilandSwedenSwitzerlandSyrian Arab RepublicTajikistanTanzaniaThailandTimor-LesteTogoTongaTrinidad and TobagoTunisiaTurkeyTurkmenistanTuvaluUgandaUkraineUnited Arab EmiratesUnited KingdomUnited StatesUpper middle incomeUruguayUzbekistanVanuatuVenezuela, RBVietnamWest Bank and GazaWorldYemen, Rep.ZambiaZimbabwe Timeline:
This timeline shows a graph from 1961 to 2016 of Costa Rica. No data until 1960. Number of actual observations by date: 56.
Source name:
World Development Indicators
Source organization:
World Bank national accounts data, and OECD National Accounts data files.
Categories, topics:
Agriculture & Rural Development, Economy & Growth
Last updated:
apr 23, 2017
Indicators value changes by year
Minimum:
123.758 mln
jan 1, 1963
Maximum:
2.724 bln
jan 1, 2016
At the date of observation
Value
Absolute change
Change from previous value
jan 1, 1961
132.126 mln
+132.126 mln
0.0%
jan 1, 1962
126.243 mln
-5.883 mln
-4.45%
jan 1, 1963
123.758 mln
-2.485 mln
-1.97%
jan 1, 1964
125.231 mln
+1.474 mln
1.19%
jan 1, 1965
133.306 mln
+8.075 mln
6.45%
jan 1, 1966
139.472 mln
+6.165 mln
4.63%
jan 1, 1967
150.053 mln
+10.581 mln
7.59%
jan 1, 1968
162.279 mln
+12.226 mln
8.15%
jan 1, 1969
180.136 mln
+17.857 mln
11.0%
jan 1, 1970
197.615 mln
+17.479 mln
9.7%
jan 1, 1971
221.781 mln
+24.166 mln
12.23%
jan 1, 1972
220.004 mln
-1.778 mln
-0.8%
jan 1, 1973
248.817 mln
+28.813 mln
13.1%
jan 1, 1974
309.262 mln
+60.445 mln
24.29%
jan 1, 1975
323.632 mln
+14.37 mln
4.65%
jan 1, 1976
398.81 mln
+75.178 mln
23.23%
jan 1, 1977
491.587 mln
+92.777 mln
23.26%
jan 1, 1978
672.415 mln
+180.828 mln
36.78%
jan 1, 1979
719.218 mln
+46.803 mln
6.96%
jan 1, 1980
746.628 mln
+27.41 mln
3.81%
jan 1, 1981
860.222 mln
+113.594 mln
15.21%
jan 1, 1982
603.976 mln
-256.246 mln
-29.79%
jan 1, 1983
638.485 mln
+34.509 mln
5.71%
jan 1, 1984
488.136 mln
-150.348 mln
-23.55%
jan 1, 1985
540.044 mln
+51.908 mln
10.63%
jan 1, 1986
506.536 mln
-33.508 mln
-6.2%
jan 1, 1987
643.003 mln
+136.467 mln
26.94%
jan 1, 1988
704.032 mln
+61.029 mln
9.49%
jan 1, 1989
711.984 mln
+7.952 mln
1.13%
jan 1, 1990
770.433 mln
+58.449 mln
8.21%
jan 1, 1991
821.066 mln
+50.633 mln
6.57%
jan 1, 1992
859.563 mln
+38.497 mln
4.69%
jan 1, 1993
1.019 bln
+159.571 mln
18.56%
jan 1, 1994
1.133 bln
+114.35 mln
11.22%
jan 1, 1995
1.292 bln
+158.485 mln
13.98%
jan 1, 1996
1.477 bln
+185.244 mln
14.34%
jan 1, 1997
1.413 bln
-63.831 mln
-4.32%
jan 1, 1998
1.577 bln
+163.835 mln
11.59%
jan 1, 1999
1.727 bln
+149.597 mln
9.48%
jan 1, 2000
1.584 bln
-143.14 mln
-8.29%
jan 1, 2001
1.389 bln
-195.088 mln
-12.32%
jan 1, 2002
1.339 bln
-49.855 mln
-3.59%
jan 1, 2003
1.397 bln
+58.492 mln
4.37%
jan 1, 2004
1.527 bln
+129.603 mln
9.28%
jan 1, 2005
1.648 bln
+120.734 mln
7.91%
jan 1, 2006
1.728 bln
+80.731 mln
4.9%
jan 1, 2007
1.915 bln
+186.398 mln
10.79%
jan 1, 2008
2.128 bln
+213.313 mln
11.14%
jan 1, 2009
2.149 bln
+21.026 mln
0.99%
jan 1, 2010
2.167 bln
+18.433 mln
0.86%
jan 1, 2011
2.455 bln
+287.493 mln
13.26%
jan 1, 2012
2.467 bln
+12.546 mln
0.51%
jan 1, 2013
2.514 bln
+46.387 mln
1.88%
jan 1, 2014
2.508 bln
-5.809 mln
-0.23%
jan 1, 2015
2.626 bln
+118.245 mln
4.71%
jan 1, 2016
2.724 bln
+97.274 mln
3.7%
Ranking of countries by current statistics by years


Comments: