29
/
en
AIzaSyAYiBZKx7MnpbEhh9jyipgxe19OcubqV5w
April 1, 2024
99529
Cameroon
CMR
true
2
1
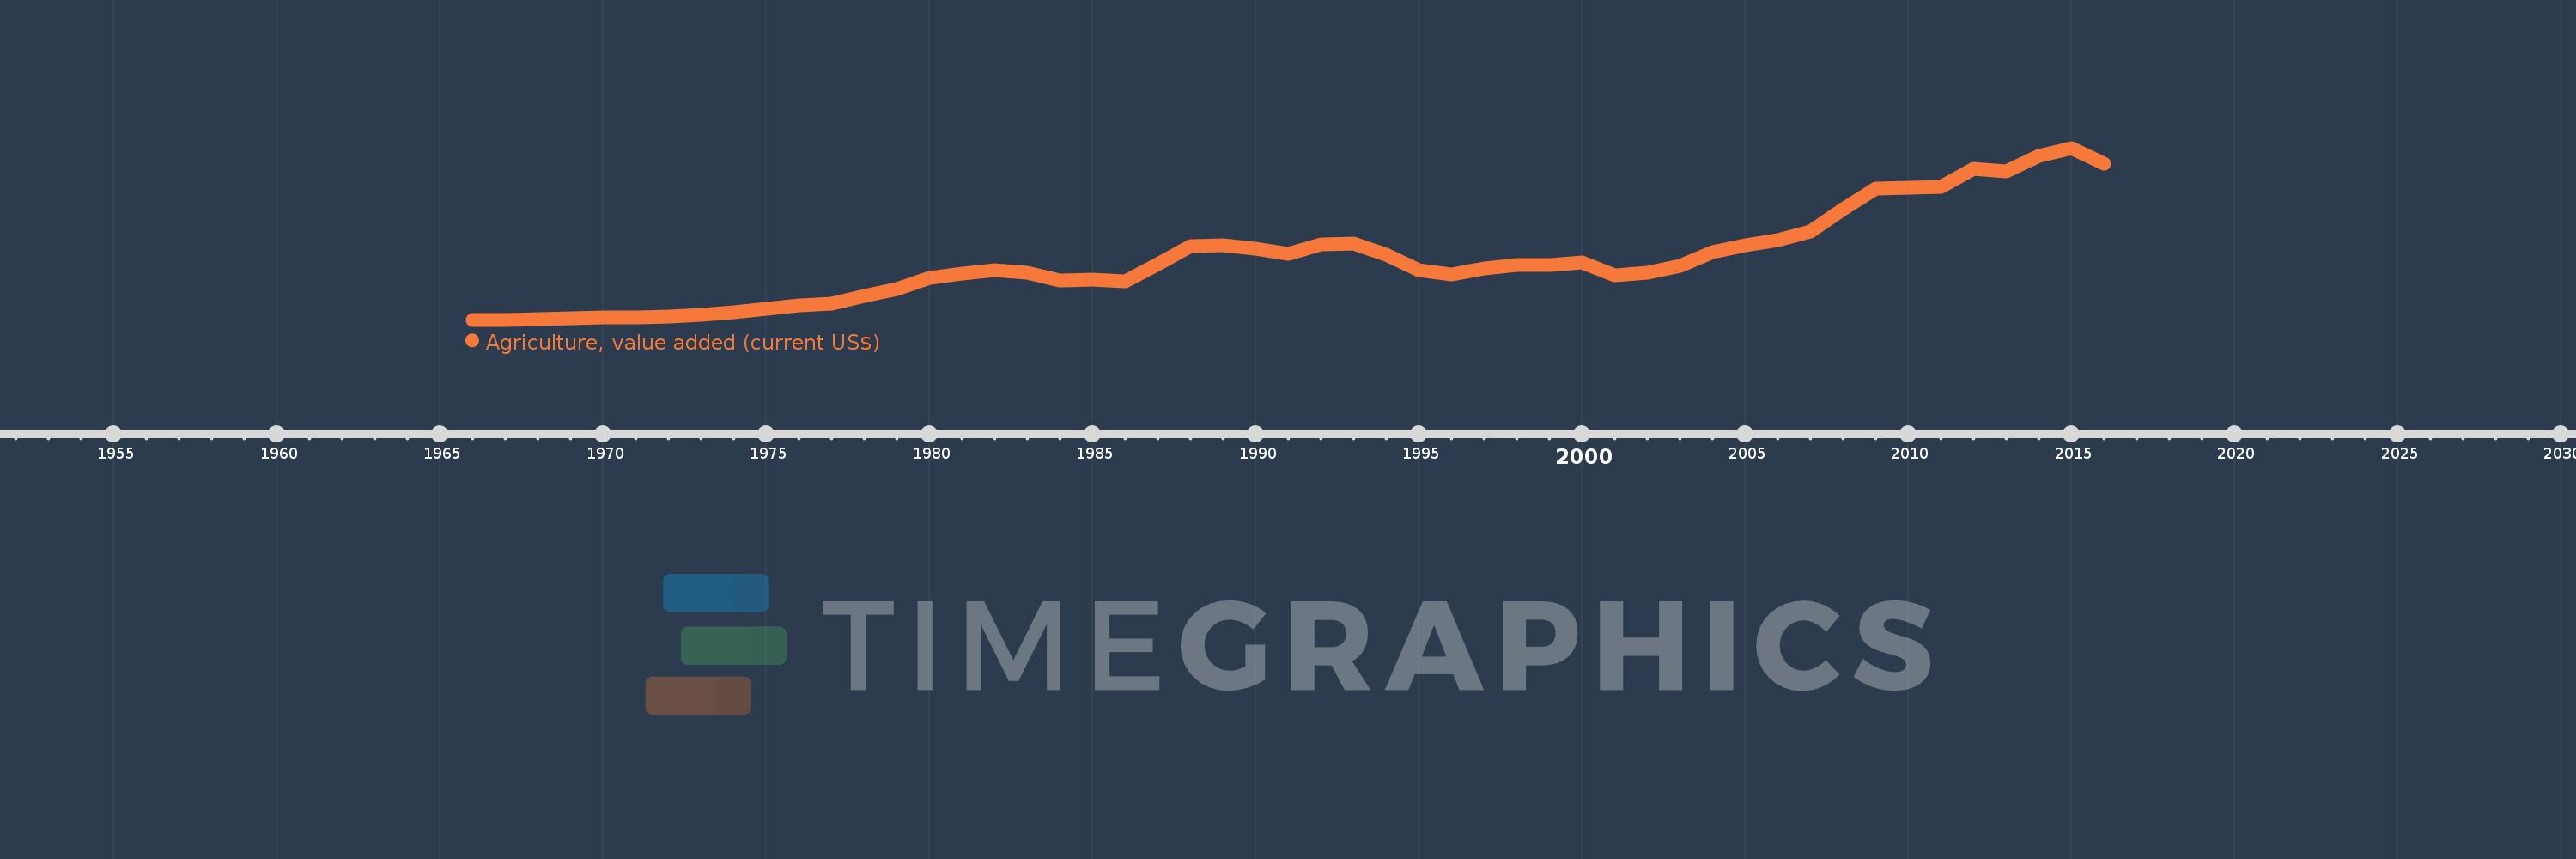
Agriculture, value added (current US$)
2016,2015,2014,2013,2012,2011,2010,2009,2008,2007,2006,2005,2004,2003,2002,2001,2000,1999,1998,1997,1996,1995,1994,1993,1992,1991,1990,1989,1988,1987,1986,1985,1984,1983,1982,1981,1980,1979,1978,1977,1976,1975,1974,1973,1972,1971,1970,1969,1968,1967,1966
This statistics in other country:
AfghanistanAlbaniaAlgeriaAndorraAngolaAntigua and BarbudaArab WorldArgentinaArmeniaArubaAustraliaAustriaAzerbaijanBahamas, TheBahrainBangladeshBarbadosBelarusBelgiumBelizeBeninBermudaBhutanBoliviaBosnia and HerzegovinaBotswanaBrazilBrunei DarussalamBulgariaBurkina FasoBurundiCabo VerdeCambodiaCameroonCanadaCaribbean small statesCayman IslandsCentral African RepublicCentral Europe and the BalticsChadChileChinaColombiaComorosCongo, Dem. Rep.Congo, Rep.Costa RicaCote d'IvoireCroatiaCubaCyprusCzech RepublicDenmarkDjiboutiDominicaDominican RepublicEarly-demographic dividendEast Asia & PacificEast Asia & Pacific (excluding high income)East Asia & Pacific (IDA & IBRD countries)EcuadorEgypt, Arab Rep.El SalvadorEquatorial GuineaEritreaEstoniaEthiopiaEuro areaEurope & Central AsiaEurope & Central Asia (excluding high income)Europe & Central Asia (IDA & IBRD countries)European UnionFijiFinlandFragile and conflict affected situationsFranceFrench PolynesiaGabonGambia, TheGeorgiaGermanyGhanaGreeceGrenadaGuatemalaGuineaGuinea-BissauGuyanaHeavily indebted poor countries (HIPC)High incomeHondurasHong Kong SAR, ChinaHungaryIBRD onlyIcelandIDA & IBRD totalIDA blendIDA onlyIDA totalIndiaIndonesiaIran, Islamic Rep.IraqIrelandItalyJamaicaJapanJordanKazakhstanKenyaKiribatiKorea, Rep.KosovoKuwaitKyrgyz RepublicLao PDRLate-demographic dividendLatin America & Caribbean Latin America & Caribbean (excluding high income)Latin America & the Caribbean (IDA & IBRD countries)LatviaLeast developed countries: UN classificationLebanonLesothoLiberiaLibyaLithuaniaLow & middle incomeLow incomeLower middle incomeLuxembourgMacao SAR, ChinaMacedonia, FYRMadagascarMalawiMalaysiaMaldivesMaliMaltaMarshall IslandsMauritaniaMauritiusMexicoMicronesia, Fed. Sts.Middle East & North AfricaMiddle East & North Africa (excluding high income)Middle East & North Africa (IDA & IBRD countries)Middle incomeMoldovaMongoliaMontenegroMoroccoMozambiqueMyanmarNamibiaNepalNetherlandsNew CaledoniaNew ZealandNicaraguaNigerNigeriaNorth AmericaNorwayOECD membersOmanOther small statesPakistanPalauPanamaPapua New GuineaParaguayPeruPhilippinesPolandPortugalPost-demographic dividendPre-demographic dividendPuerto RicoQatarRomaniaRussian FederationRwandaSamoaSao Tome and PrincipeSaudi ArabiaSenegalSerbiaSeychellesSierra LeoneSingaporeSlovak RepublicSloveniaSmall statesSolomon IslandsSouth AfricaSouth AsiaSouth Asia (IDA & IBRD)SpainSri LankaSt. Kitts and NevisSt. LuciaSt. Vincent and the GrenadinesSub-Saharan Africa Sub-Saharan Africa (excluding high income)Sub-Saharan Africa (IDA & IBRD countries)SudanSurinameSwazilandSwedenSwitzerlandSyrian Arab RepublicTajikistanTanzaniaThailandTimor-LesteTogoTongaTrinidad and TobagoTunisiaTurkeyTurkmenistanTuvaluUgandaUkraineUnited Arab EmiratesUnited KingdomUnited StatesUpper middle incomeUruguayUzbekistanVanuatuVenezuela, RBVietnamWest Bank and GazaWorldYemen, Rep.ZambiaZimbabwe Timeline:
This timeline shows a graph from 1966 to 2016 of Cameroon. No data until 1965. Number of actual observations by date: 51.
Source name:
World Development Indicators
Source organization:
World Bank national accounts data, and OECD National Accounts data files.
Categories, topics:
Agriculture & Rural Development, Economy & Growth
Last updated:
apr 23, 2017
Indicators value changes by year
Minimum:
266.483 mln
jan 1, 1966
Maximum:
6.53 bln
jan 1, 2015
At the date of observation
Value
Absolute change
Change from previous value
jan 1, 1966
266.483 mln
+266.483 mln
0.0%
jan 1, 1967
271.773 mln
+5.29 mln
1.99%
jan 1, 1968
290.81 mln
+19.037 mln
7.0%
jan 1, 1969
331.78 mln
+40.971 mln
14.09%
jan 1, 1970
354.063 mln
+22.283 mln
6.72%
jan 1, 1971
363.822 mln
+9.759 mln
2.76%
jan 1, 1972
382.588 mln
+18.766 mln
5.16%
jan 1, 1973
457.403 mln
+74.815 mln
19.55%
jan 1, 1974
541.562 mln
+84.159 mln
18.4%
jan 1, 1975
666.269 mln
+124.707 mln
23.03%
jan 1, 1976
801.599 mln
+135.331 mln
20.31%
jan 1, 1977
849.45 mln
+47.851 mln
5.97%
jan 1, 1978
1.133 bln
+283.167 mln
33.34%
jan 1, 1979
1.383 bln
+250.041 mln
22.08%
jan 1, 1980
1.791 bln
+408.639 mln
29.55%
jan 1, 1981
1.933 bln
+141.736 mln
7.91%
jan 1, 1982
2.075 bln
+142.265 mln
7.36%
jan 1, 1983
1.978 bln
-97.689 mln
-4.71%
jan 1, 1984
1.712 bln
-265.514 mln
-13.43%
jan 1, 1985
1.714 bln
+2.117 mln
0.12%
jan 1, 1986
1.678 bln
-36.449 mln
-2.13%
jan 1, 1987
2.297 bln
+619.555 mln
36.93%
jan 1, 1988
2.951 bln
+653.607 mln
28.45%
jan 1, 1989
2.991 bln
+40.272 mln
1.36%
jan 1, 1990
2.841 bln
-149.729 mln
-5.01%
jan 1, 1991
2.676 bln
-165.66 mln
-5.83%
jan 1, 1992
3.016 bln
+340.65 mln
12.73%
jan 1, 1993
3.029 bln
+12.644 mln
0.42%
jan 1, 1994
2.629 bln
-399.675 mln
-13.19%
jan 1, 1995
2.063 bln
-566.635 mln
-21.55%
jan 1, 1996
1.919 bln
-144.142 mln
-6.99%
jan 1, 1997
2.128 bln
+209.78 mln
10.93%
jan 1, 1998
2.249 bln
+121.05 mln
5.69%
jan 1, 1999
2.253 bln
+3.902 mln
0.17%
jan 1, 2000
2.367 bln
+113.358 mln
5.03%
jan 1, 2001
1.901 bln
-465.774 mln
-19.68%
jan 1, 2002
1.969 bln
+68.488 mln
3.6%
jan 1, 2003
2.225 bln
+255.292 mln
12.96%
jan 1, 2004
2.743 bln
+517.955 mln
23.28%
jan 1, 2005
2.992 bln
+248.952 mln
9.08%
jan 1, 2006
3.158 bln
+166.088 mln
5.55%
jan 1, 2007
3.474 bln
+316.106 mln
10.01%
jan 1, 2008
4.311 bln
+836.942 mln
24.09%
jan 1, 2009
5.04 bln
+729.285 mln
16.92%
jan 1, 2010
5.064 bln
+24.105 mln
0.48%
jan 1, 2011
5.118 bln
+53.957 mln
1.07%
jan 1, 2012
5.781 bln
+662.69 mln
12.95%
jan 1, 2013
5.669 bln
-112.011 mln
-1.94%
jan 1, 2014
6.252 bln
+583.581 mln
10.29%
jan 1, 2015
6.53 bln
+277.29 mln
4.43%
jan 1, 2016
5.957 bln
-572.289 mln
-8.76%
Ranking of countries by current statistics by years


Comments: