29
/
en
AIzaSyAYiBZKx7MnpbEhh9jyipgxe19OcubqV5w
April 1, 2024
214037
Norway
NOR
true
2
1
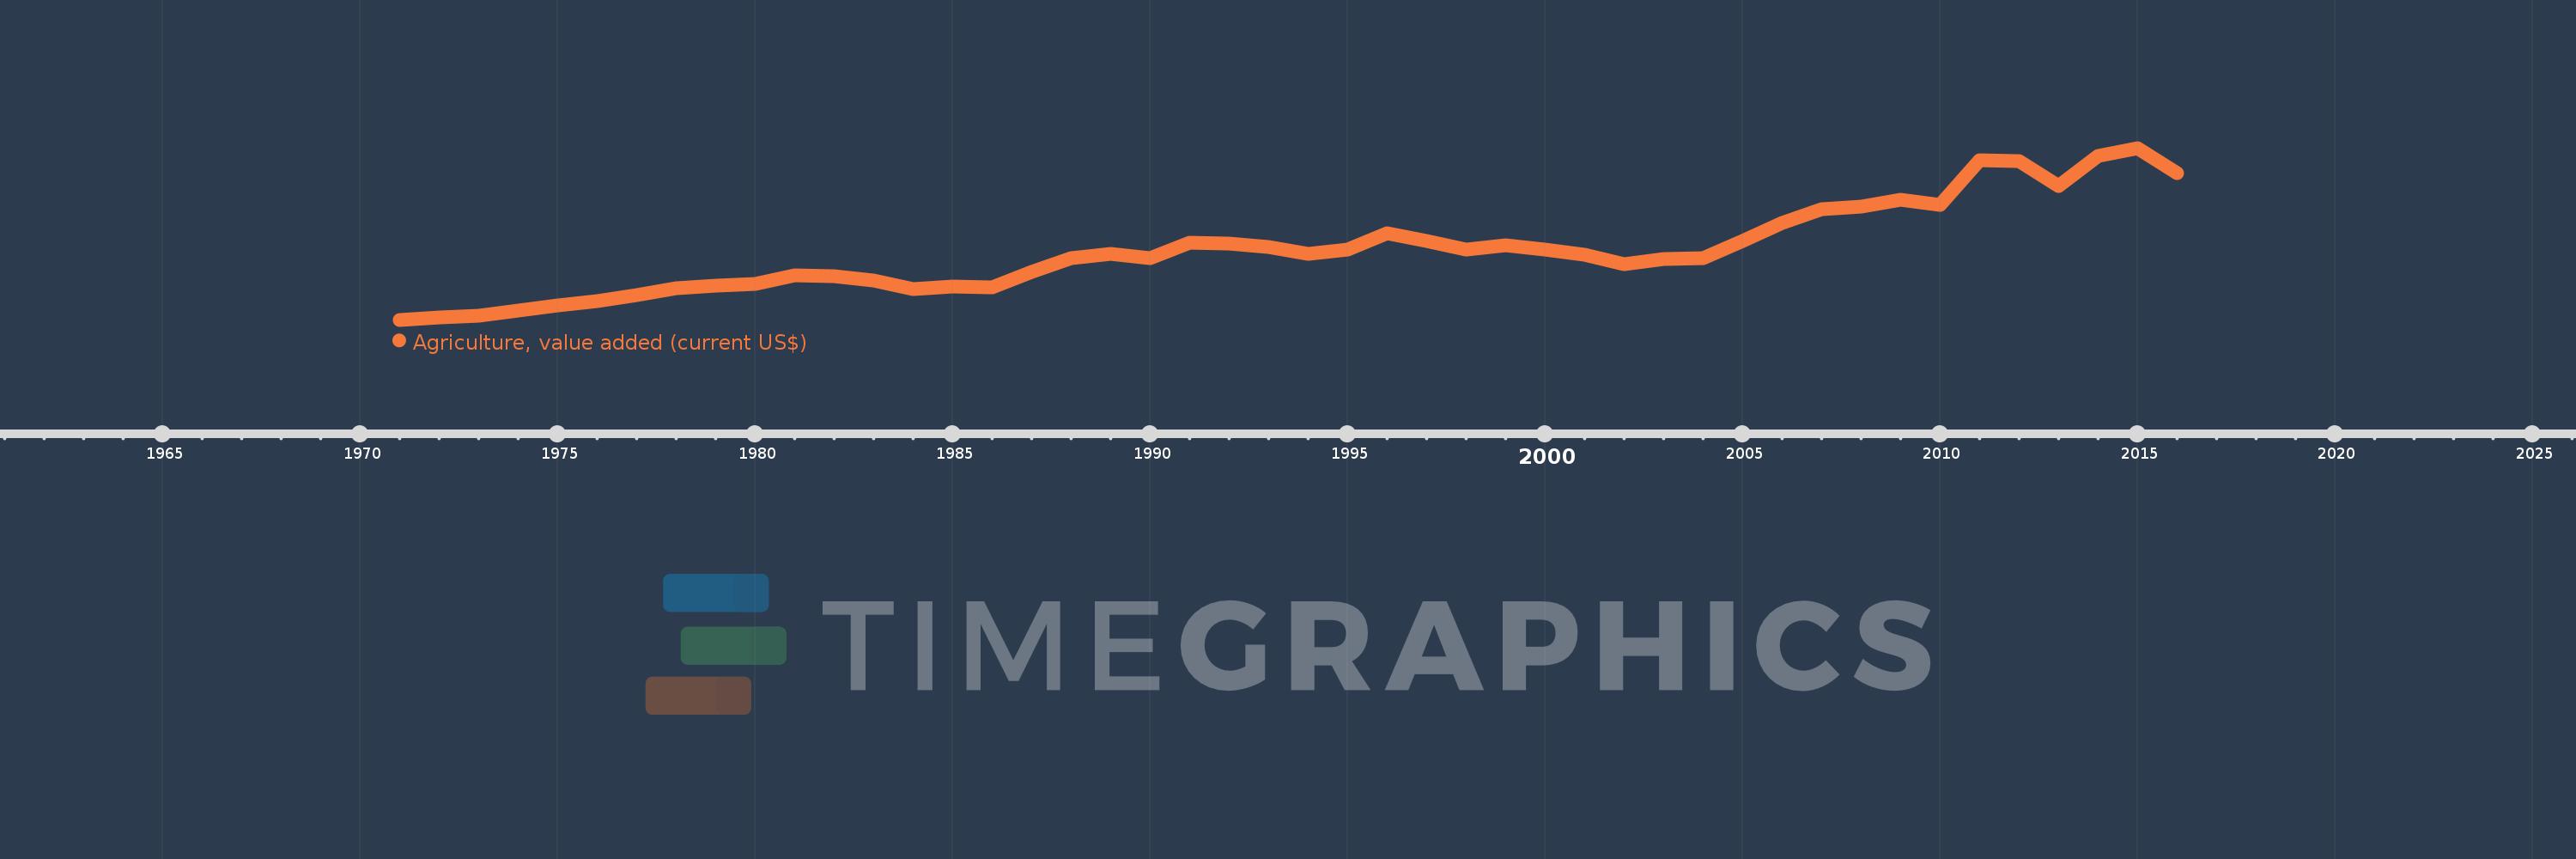
Agriculture, value added (current US$)
2016,2015,2014,2013,2012,2011,2010,2009,2008,2007,2006,2005,2004,2003,2002,2001,2000,1999,1998,1997,1996,1995,1994,1993,1992,1991,1990,1989,1988,1987,1986,1985,1984,1983,1982,1981,1980,1979,1978,1977,1976,1975,1974,1973,1972,1971
This statistics in other country:
AfghanistanAlbaniaAlgeriaAndorraAngolaAntigua and BarbudaArab WorldArgentinaArmeniaArubaAustraliaAustriaAzerbaijanBahamas, TheBahrainBangladeshBarbadosBelarusBelgiumBelizeBeninBermudaBhutanBoliviaBosnia and HerzegovinaBotswanaBrazilBrunei DarussalamBulgariaBurkina FasoBurundiCabo VerdeCambodiaCameroonCanadaCaribbean small statesCayman IslandsCentral African RepublicCentral Europe and the BalticsChadChileChinaColombiaComorosCongo, Dem. Rep.Congo, Rep.Costa RicaCote d'IvoireCroatiaCubaCyprusCzech RepublicDenmarkDjiboutiDominicaDominican RepublicEarly-demographic dividendEast Asia & PacificEast Asia & Pacific (excluding high income)East Asia & Pacific (IDA & IBRD countries)EcuadorEgypt, Arab Rep.El SalvadorEquatorial GuineaEritreaEstoniaEthiopiaEuro areaEurope & Central AsiaEurope & Central Asia (excluding high income)Europe & Central Asia (IDA & IBRD countries)European UnionFijiFinlandFragile and conflict affected situationsFranceFrench PolynesiaGabonGambia, TheGeorgiaGermanyGhanaGreeceGrenadaGuatemalaGuineaGuinea-BissauGuyanaHeavily indebted poor countries (HIPC)High incomeHondurasHong Kong SAR, ChinaHungaryIBRD onlyIcelandIDA & IBRD totalIDA blendIDA onlyIDA totalIndiaIndonesiaIran, Islamic Rep.IraqIrelandItalyJamaicaJapanJordanKazakhstanKenyaKiribatiKorea, Rep.KosovoKuwaitKyrgyz RepublicLao PDRLate-demographic dividendLatin America & Caribbean Latin America & Caribbean (excluding high income)Latin America & the Caribbean (IDA & IBRD countries)LatviaLeast developed countries: UN classificationLebanonLesothoLiberiaLibyaLithuaniaLow & middle incomeLow incomeLower middle incomeLuxembourgMacao SAR, ChinaMacedonia, FYRMadagascarMalawiMalaysiaMaldivesMaliMaltaMarshall IslandsMauritaniaMauritiusMexicoMicronesia, Fed. Sts.Middle East & North AfricaMiddle East & North Africa (excluding high income)Middle East & North Africa (IDA & IBRD countries)Middle incomeMoldovaMongoliaMontenegroMoroccoMozambiqueMyanmarNamibiaNepalNetherlandsNew CaledoniaNew ZealandNicaraguaNigerNigeriaNorth AmericaNorwayOECD membersOmanOther small statesPakistanPalauPanamaPapua New GuineaParaguayPeruPhilippinesPolandPortugalPost-demographic dividendPre-demographic dividendPuerto RicoQatarRomaniaRussian FederationRwandaSamoaSao Tome and PrincipeSaudi ArabiaSenegalSerbiaSeychellesSierra LeoneSingaporeSlovak RepublicSloveniaSmall statesSolomon IslandsSouth AfricaSouth AsiaSouth Asia (IDA & IBRD)SpainSri LankaSt. Kitts and NevisSt. LuciaSt. Vincent and the GrenadinesSub-Saharan Africa Sub-Saharan Africa (excluding high income)Sub-Saharan Africa (IDA & IBRD countries)SudanSurinameSwazilandSwedenSwitzerlandSyrian Arab RepublicTajikistanTanzaniaThailandTimor-LesteTogoTongaTrinidad and TobagoTunisiaTurkeyTurkmenistanTuvaluUgandaUkraineUnited Arab EmiratesUnited KingdomUnited StatesUpper middle incomeUruguayUzbekistanVanuatuVenezuela, RBVietnamWest Bank and GazaWorldYemen, Rep.ZambiaZimbabwe Timeline:
This timeline shows a graph from 1971 to 2016 of Norway. No data until 1970. Number of actual observations by date: 46.
Source name:
World Development Indicators
Source organization:
World Bank national accounts data, and OECD National Accounts data files.
Categories, topics:
Agriculture & Rural Development, Economy & Growth
Last updated:
apr 23, 2017
Indicators value changes by year
Minimum:
653.656 mln
jan 1, 1971
Maximum:
7.191 bln
jan 1, 2015
At the date of observation
Value
Absolute change
Change from previous value
jan 1, 1971
653.656 mln
+653.656 mln
0.0%
jan 1, 1972
740.09 mln
+86.434 mln
13.22%
jan 1, 1973
796.272 mln
+56.182 mln
7.59%
jan 1, 1974
1.002 bln
+205.497 mln
25.81%
jan 1, 1975
1.193 bln
+190.895 mln
19.06%
jan 1, 1976
1.353 bln
+160.528 mln
13.46%
jan 1, 1977
1.583 bln
+229.691 mln
16.97%
jan 1, 1978
1.841 bln
+257.824 mln
16.29%
jan 1, 1979
1.967 bln
+126.751 mln
6.89%
jan 1, 1980
2.008 bln
+40.995 mln
2.08%
jan 1, 1981
2.337 bln
+328.162 mln
16.34%
jan 1, 1982
2.302 bln
-34.845 mln
-1.49%
jan 1, 1983
2.142 bln
-159.996 mln
-6.95%
jan 1, 1984
1.824 bln
-317.859 mln
-14.84%
jan 1, 1985
1.906 bln
+81.864 mln
4.49%
jan 1, 1986
1.871 bln
-35.168 mln
-1.85%
jan 1, 1987
2.462 bln
+591.425 mln
31.62%
jan 1, 1988
3.012 bln
+550.063 mln
22.34%
jan 1, 1989
3.145 bln
+132.449 mln
4.4%
jan 1, 1990
2.982 bln
-162.866 mln
-5.18%
jan 1, 1991
3.575 bln
+592.934 mln
19.89%
jan 1, 1992
3.547 bln
-27.28 mln
-0.76%
jan 1, 1993
3.438 bln
-109.244 mln
-3.08%
jan 1, 1994
3.146 bln
-291.671 mln
-8.48%
jan 1, 1995
3.31 bln
+163.631 mln
5.2%
jan 1, 1996
3.937 bln
+626.844 mln
18.94%
jan 1, 1997
3.642 bln
-295.074 mln
-7.5%
jan 1, 1998
3.327 bln
-314.988 mln
-8.65%
jan 1, 1999
3.491 bln
+163.78 mln
4.92%
jan 1, 2000
3.33 bln
-160.781 mln
-4.61%
jan 1, 2001
3.122 bln
-207.967 mln
-6.25%
jan 1, 2002
2.764 bln
-357.979 mln
-11.47%
jan 1, 2003
2.973 bln
+209.514 mln
7.58%
jan 1, 2004
2.994 bln
+20.163 mln
0.68%
jan 1, 2005
3.667 bln
+673.809 mln
22.51%
jan 1, 2006
4.335 bln
+667.594 mln
18.2%
jan 1, 2007
4.854 bln
+518.544 mln
11.96%
jan 1, 2008
4.971 bln
+117.576 mln
2.42%
jan 1, 2009
5.214 bln
+243.101 mln
4.89%
jan 1, 2010
5.022 bln
-192.477 mln
-3.69%
jan 1, 2011
6.725 bln
+1.704 bln
33.93%
jan 1, 2012
6.7 bln
-25.245 mln
-0.38%
jan 1, 2013
5.747 bln
-953.24 mln
-14.23%
jan 1, 2014
6.876 bln
+1.129 bln
19.64%
jan 1, 2015
7.191 bln
+315.357 mln
4.59%
jan 1, 2016
6.236 bln
-955.538 mln
-13.29%
Ranking of countries by current statistics by years


Comments: