29
/
en
AIzaSyAYiBZKx7MnpbEhh9jyipgxe19OcubqV5w
April 1, 2024
204942
Namibia
NAM
true
2
1
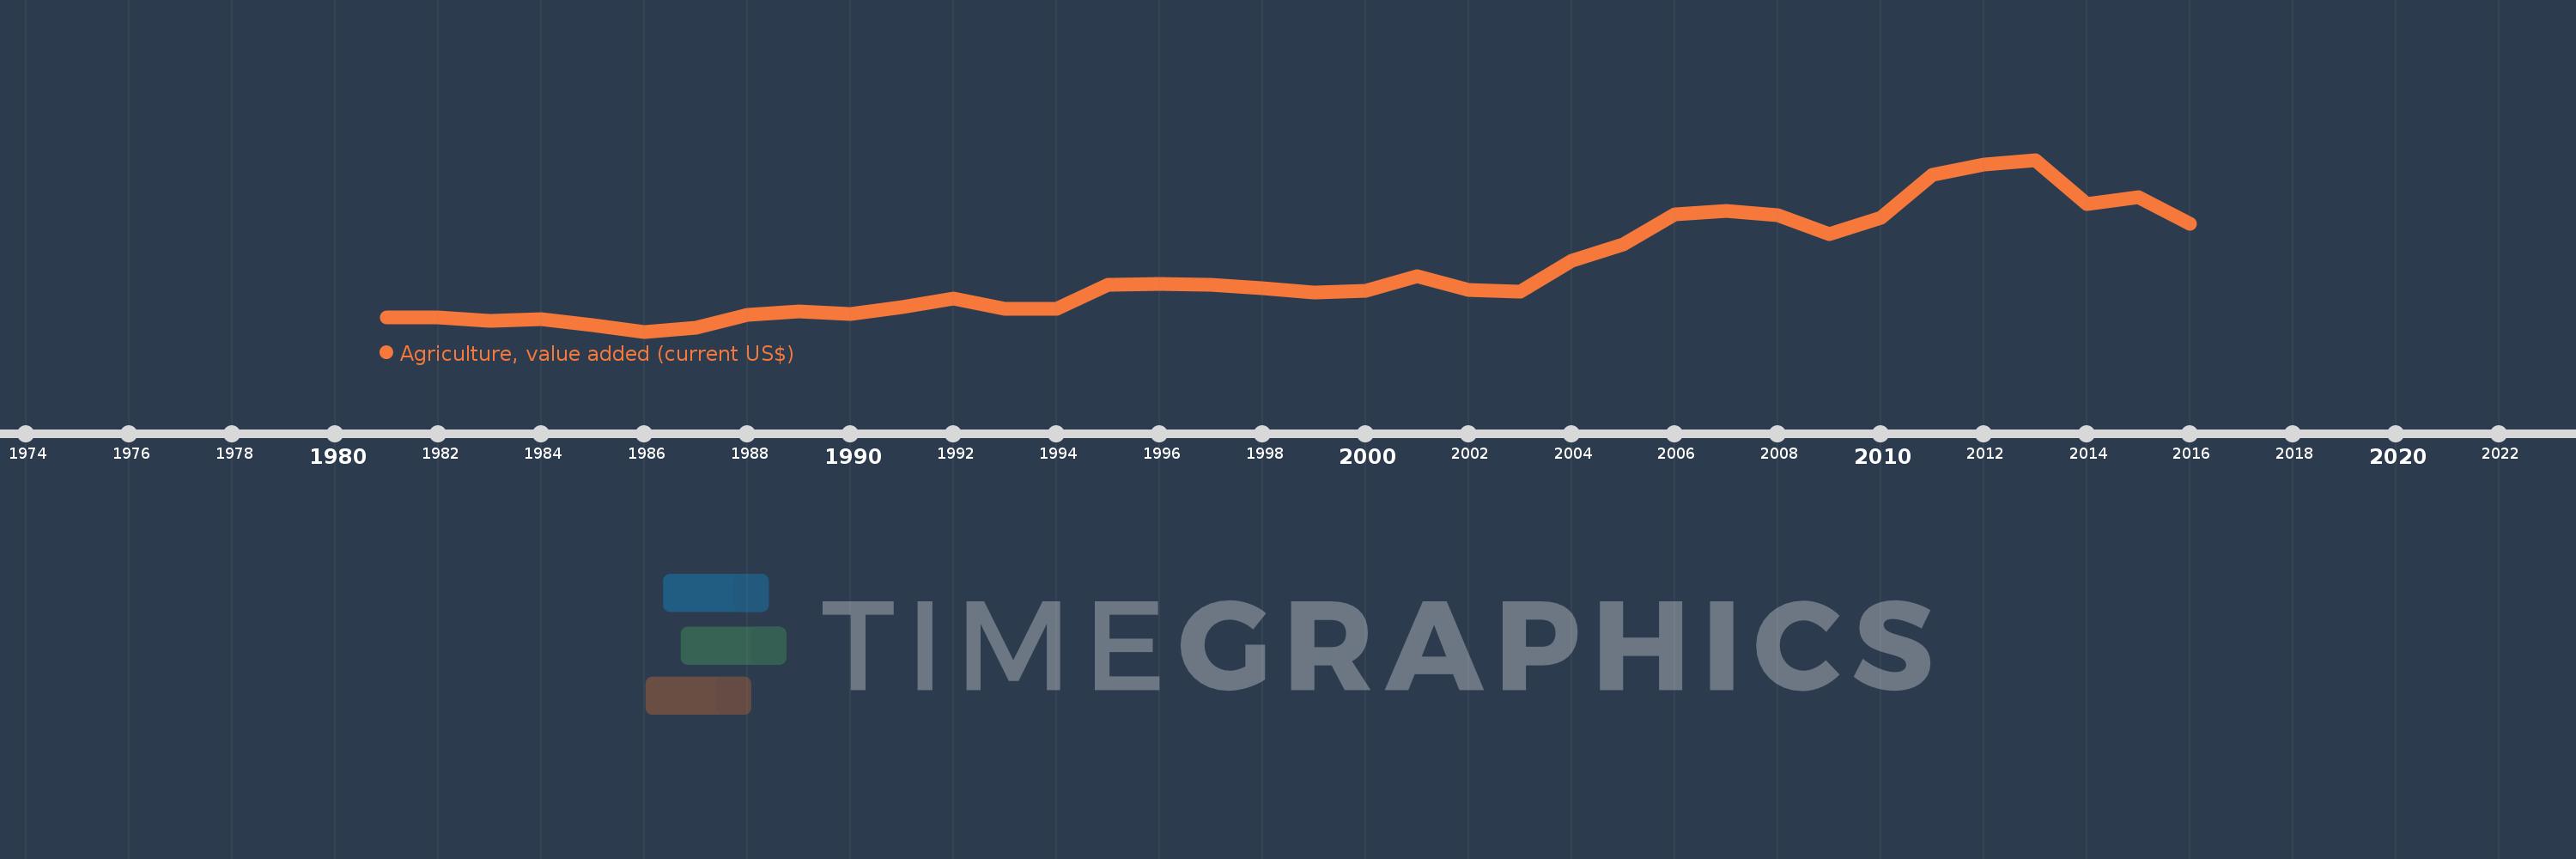
Agriculture, value added (current US$)
2016,2015,2014,2013,2012,2011,2010,2009,2008,2007,2006,2005,2004,2003,2002,2001,2000,1999,1998,1997,1996,1995,1994,1993,1992,1991,1990,1989,1988,1987,1986,1985,1984,1983,1982,1981
This statistics in other country:
AfghanistanAlbaniaAlgeriaAndorraAngolaAntigua and BarbudaArab WorldArgentinaArmeniaArubaAustraliaAustriaAzerbaijanBahamas, TheBahrainBangladeshBarbadosBelarusBelgiumBelizeBeninBermudaBhutanBoliviaBosnia and HerzegovinaBotswanaBrazilBrunei DarussalamBulgariaBurkina FasoBurundiCabo VerdeCambodiaCameroonCanadaCaribbean small statesCayman IslandsCentral African RepublicCentral Europe and the BalticsChadChileChinaColombiaComorosCongo, Dem. Rep.Congo, Rep.Costa RicaCote d'IvoireCroatiaCubaCyprusCzech RepublicDenmarkDjiboutiDominicaDominican RepublicEarly-demographic dividendEast Asia & PacificEast Asia & Pacific (excluding high income)East Asia & Pacific (IDA & IBRD countries)EcuadorEgypt, Arab Rep.El SalvadorEquatorial GuineaEritreaEstoniaEthiopiaEuro areaEurope & Central AsiaEurope & Central Asia (excluding high income)Europe & Central Asia (IDA & IBRD countries)European UnionFijiFinlandFragile and conflict affected situationsFranceFrench PolynesiaGabonGambia, TheGeorgiaGermanyGhanaGreeceGrenadaGuatemalaGuineaGuinea-BissauGuyanaHeavily indebted poor countries (HIPC)High incomeHondurasHong Kong SAR, ChinaHungaryIBRD onlyIcelandIDA & IBRD totalIDA blendIDA onlyIDA totalIndiaIndonesiaIran, Islamic Rep.IraqIrelandItalyJamaicaJapanJordanKazakhstanKenyaKiribatiKorea, Rep.KosovoKuwaitKyrgyz RepublicLao PDRLate-demographic dividendLatin America & Caribbean Latin America & Caribbean (excluding high income)Latin America & the Caribbean (IDA & IBRD countries)LatviaLeast developed countries: UN classificationLebanonLesothoLiberiaLibyaLithuaniaLow & middle incomeLow incomeLower middle incomeLuxembourgMacao SAR, ChinaMacedonia, FYRMadagascarMalawiMalaysiaMaldivesMaliMaltaMarshall IslandsMauritaniaMauritiusMexicoMicronesia, Fed. Sts.Middle East & North AfricaMiddle East & North Africa (excluding high income)Middle East & North Africa (IDA & IBRD countries)Middle incomeMoldovaMongoliaMontenegroMoroccoMozambiqueMyanmarNamibiaNepalNetherlandsNew CaledoniaNew ZealandNicaraguaNigerNigeriaNorth AmericaNorwayOECD membersOmanOther small statesPakistanPalauPanamaPapua New GuineaParaguayPeruPhilippinesPolandPortugalPost-demographic dividendPre-demographic dividendPuerto RicoQatarRomaniaRussian FederationRwandaSamoaSao Tome and PrincipeSaudi ArabiaSenegalSerbiaSeychellesSierra LeoneSingaporeSlovak RepublicSloveniaSmall statesSolomon IslandsSouth AfricaSouth AsiaSouth Asia (IDA & IBRD)SpainSri LankaSt. Kitts and NevisSt. LuciaSt. Vincent and the GrenadinesSub-Saharan Africa Sub-Saharan Africa (excluding high income)Sub-Saharan Africa (IDA & IBRD countries)SudanSurinameSwazilandSwedenSwitzerlandSyrian Arab RepublicTajikistanTanzaniaThailandTimor-LesteTogoTongaTrinidad and TobagoTunisiaTurkeyTurkmenistanTuvaluUgandaUkraineUnited Arab EmiratesUnited KingdomUnited StatesUpper middle incomeUruguayUzbekistanVanuatuVenezuela, RBVietnamWest Bank and GazaWorldYemen, Rep.ZambiaZimbabwe Timeline:
This timeline shows a graph from 1981 to 2016 of Namibia. No data until 1980. Number of actual observations by date: 36.
Source name:
World Development Indicators
Source organization:
World Bank national accounts data, and OECD National Accounts data files.
Categories, topics:
Agriculture & Rural Development, Economy & Growth
Last updated:
apr 23, 2017
Indicators value changes by year
Minimum:
118.879 mln
jan 1, 1986
Maximum:
1.048 bln
jan 1, 2013
At the date of observation
Value
Absolute change
Change from previous value
jan 1, 1981
194.336 mln
+194.336 mln
0.0%
jan 1, 1982
196.663 mln
+2.327 mln
1.2%
jan 1, 1983
179.213 mln
-17.45 mln
-8.87%
jan 1, 1984
185.14 mln
+5.927 mln
3.31%
jan 1, 1985
154.796 mln
-30.344 mln
-16.39%
jan 1, 1986
118.879 mln
-35.917 mln
-23.2%
jan 1, 1987
140.165 mln
+21.286 mln
17.91%
jan 1, 1988
210.115 mln
+69.949 mln
49.9%
jan 1, 1989
228.673 mln
+18.559 mln
8.83%
jan 1, 1990
214.42 mln
-14.254 mln
-6.23%
jan 1, 1991
252.64 mln
+38.22 mln
17.82%
jan 1, 1992
298.889 mln
+46.249 mln
18.31%
jan 1, 1993
242.923 mln
-55.966 mln
-18.72%
jan 1, 1994
241.252 mln
-1.671 mln
-0.69%
jan 1, 1995
371.386 mln
+130.134 mln
53.94%
jan 1, 1996
375.863 mln
+4.477 mln
1.21%
jan 1, 1997
372.188 mln
-3.676 mln
-0.98%
jan 1, 1998
353.596 mln
-18.592 mln
-5.0%
jan 1, 1999
332.644 mln
-20.952 mln
-5.93%
jan 1, 2000
339.125 mln
+6.482 mln
1.95%
jan 1, 2001
420.897 mln
+81.772 mln
24.11%
jan 1, 2002
344.189 mln
-76.709 mln
-18.23%
jan 1, 2003
336.229 mln
-7.959 mln
-2.31%
jan 1, 2004
503.256 mln
+167.026 mln
49.68%
jan 1, 2005
590.848 mln
+87.592 mln
17.41%
jan 1, 2006
753.653 mln
+162.805 mln
27.55%
jan 1, 2007
771.388 mln
+17.735 mln
2.35%
jan 1, 2008
747.072 mln
-24.316 mln
-3.15%
jan 1, 2009
647.543 mln
-99.53 mln
-13.32%
jan 1, 2010
732.572 mln
+85.03 mln
13.13%
jan 1, 2011
967.763 mln
+235.191 mln
32.1%
jan 1, 2012
1.022 bln
+53.783 mln
5.56%
jan 1, 2013
1.048 bln
+26.847 mln
2.63%
jan 1, 2014
806.929 mln
-241.464 mln
-23.03%
jan 1, 2015
844.763 mln
+37.834 mln
4.69%
jan 1, 2016
703.092 mln
-141.672 mln
-16.77%
Ranking of countries by current statistics by years


Comments: