29
/
en
AIzaSyAYiBZKx7MnpbEhh9jyipgxe19OcubqV5w
April 1, 2024
117622
Czech Republic
CZE
true
2
1
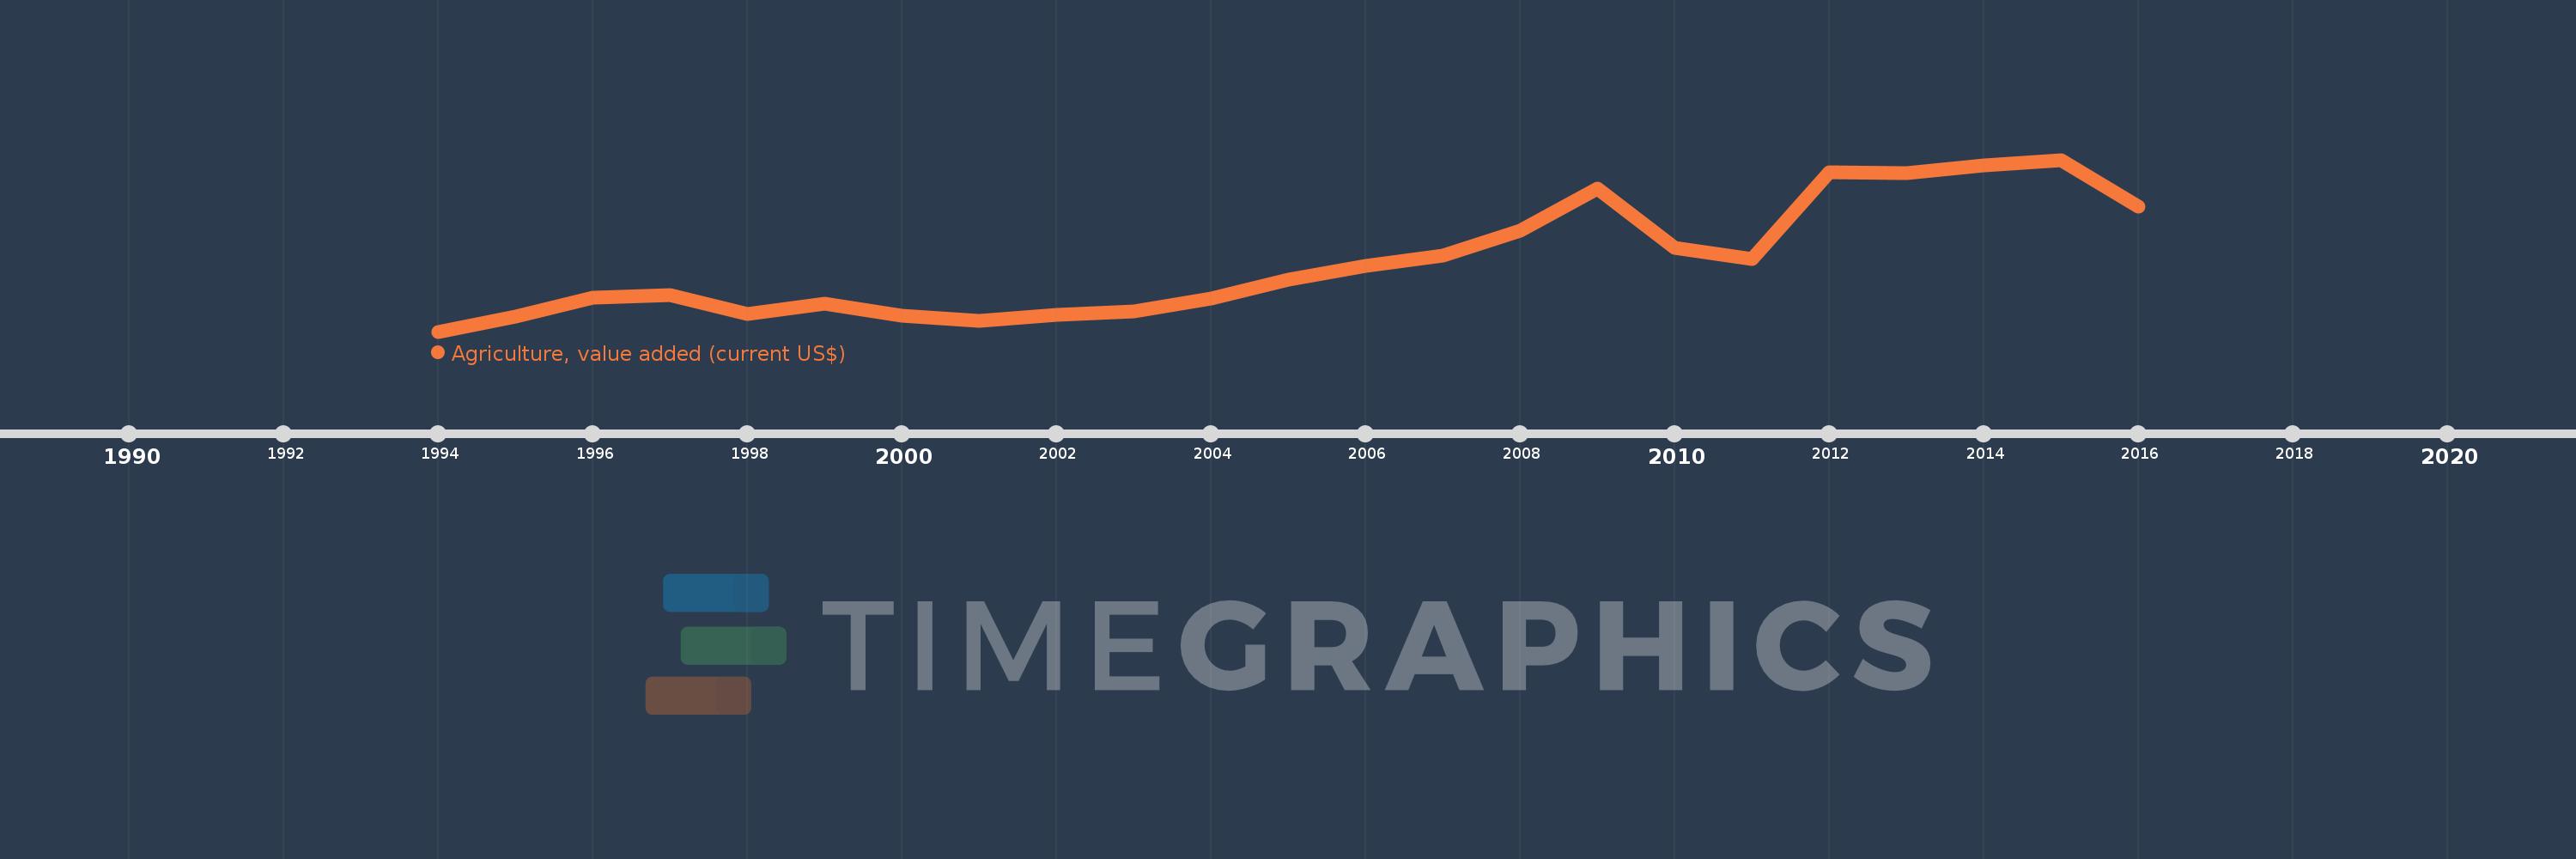
Agriculture, value added (current US$)
2016,2015,2014,2013,2012,2011,2010,2009,2008,2007,2006,2005,2004,2003,2002,2001,2000,1999,1998,1997,1996,1995,1994
This statistics in other country:
AfghanistanAlbaniaAlgeriaAndorraAngolaAntigua and BarbudaArab WorldArgentinaArmeniaArubaAustraliaAustriaAzerbaijanBahamas, TheBahrainBangladeshBarbadosBelarusBelgiumBelizeBeninBermudaBhutanBoliviaBosnia and HerzegovinaBotswanaBrazilBrunei DarussalamBulgariaBurkina FasoBurundiCabo VerdeCambodiaCameroonCanadaCaribbean small statesCayman IslandsCentral African RepublicCentral Europe and the BalticsChadChileChinaColombiaComorosCongo, Dem. Rep.Congo, Rep.Costa RicaCote d'IvoireCroatiaCubaCyprusCzech RepublicDenmarkDjiboutiDominicaDominican RepublicEarly-demographic dividendEast Asia & PacificEast Asia & Pacific (excluding high income)East Asia & Pacific (IDA & IBRD countries)EcuadorEgypt, Arab Rep.El SalvadorEquatorial GuineaEritreaEstoniaEthiopiaEuro areaEurope & Central AsiaEurope & Central Asia (excluding high income)Europe & Central Asia (IDA & IBRD countries)European UnionFijiFinlandFragile and conflict affected situationsFranceFrench PolynesiaGabonGambia, TheGeorgiaGermanyGhanaGreeceGrenadaGuatemalaGuineaGuinea-BissauGuyanaHeavily indebted poor countries (HIPC)High incomeHondurasHong Kong SAR, ChinaHungaryIBRD onlyIcelandIDA & IBRD totalIDA blendIDA onlyIDA totalIndiaIndonesiaIran, Islamic Rep.IraqIrelandItalyJamaicaJapanJordanKazakhstanKenyaKiribatiKorea, Rep.KosovoKuwaitKyrgyz RepublicLao PDRLate-demographic dividendLatin America & Caribbean Latin America & Caribbean (excluding high income)Latin America & the Caribbean (IDA & IBRD countries)LatviaLeast developed countries: UN classificationLebanonLesothoLiberiaLibyaLithuaniaLow & middle incomeLow incomeLower middle incomeLuxembourgMacao SAR, ChinaMacedonia, FYRMadagascarMalawiMalaysiaMaldivesMaliMaltaMarshall IslandsMauritaniaMauritiusMexicoMicronesia, Fed. Sts.Middle East & North AfricaMiddle East & North Africa (excluding high income)Middle East & North Africa (IDA & IBRD countries)Middle incomeMoldovaMongoliaMontenegroMoroccoMozambiqueMyanmarNamibiaNepalNetherlandsNew CaledoniaNew ZealandNicaraguaNigerNigeriaNorth AmericaNorwayOECD membersOmanOther small statesPakistanPalauPanamaPapua New GuineaParaguayPeruPhilippinesPolandPortugalPost-demographic dividendPre-demographic dividendPuerto RicoQatarRomaniaRussian FederationRwandaSamoaSao Tome and PrincipeSaudi ArabiaSenegalSerbiaSeychellesSierra LeoneSingaporeSlovak RepublicSloveniaSmall statesSolomon IslandsSouth AfricaSouth AsiaSouth Asia (IDA & IBRD)SpainSri LankaSt. Kitts and NevisSt. LuciaSt. Vincent and the GrenadinesSub-Saharan Africa Sub-Saharan Africa (excluding high income)Sub-Saharan Africa (IDA & IBRD countries)SudanSurinameSwazilandSwedenSwitzerlandSyrian Arab RepublicTajikistanTanzaniaThailandTimor-LesteTogoTongaTrinidad and TobagoTunisiaTurkeyTurkmenistanTuvaluUgandaUkraineUnited Arab EmiratesUnited KingdomUnited StatesUpper middle incomeUruguayUzbekistanVanuatuVenezuela, RBVietnamWest Bank and GazaWorldYemen, Rep.ZambiaZimbabwe Timeline:
This timeline shows a graph from 1994 to 2016 of Czech Republic. No data until 1993. Number of actual observations by date: 23.
Source name:
World Development Indicators
Source organization:
World Bank national accounts data, and OECD National Accounts data files.
Categories, topics:
Agriculture & Rural Development, Economy & Growth
Last updated:
apr 23, 2017
Indicators value changes by year
Minimum:
1.698 bln
jan 1, 1994
Maximum:
5.141 bln
jan 1, 2015
At the date of observation
Value
Absolute change
Change from previous value
jan 1, 1994
1.698 bln
+1.698 bln
0.0%
jan 1, 1995
1.997 bln
+298.321 mln
17.57%
jan 1, 1996
2.37 bln
+373.732 mln
18.72%
jan 1, 1997
2.425 bln
+55.092 mln
2.32%
jan 1, 1998
2.049 bln
-376.005 mln
-15.5%
jan 1, 1999
2.26 bln
+210.774 mln
10.28%
jan 1, 2000
2.024 bln
-236.374 mln
-10.46%
jan 1, 2001
1.92 bln
-103.598 mln
-5.12%
jan 1, 2002
2.03 bln
+110.0 mln
5.73%
jan 1, 2003
2.099 bln
+69.189 mln
3.41%
jan 1, 2004
2.353 bln
+253.55 mln
12.08%
jan 1, 2005
2.747 bln
+394.516 mln
16.77%
jan 1, 2006
3.013 bln
+265.812 mln
9.67%
jan 1, 2007
3.223 bln
+209.53 mln
6.95%
jan 1, 2008
3.715 bln
+492.101 mln
15.27%
jan 1, 2009
4.557 bln
+842.353 mln
22.68%
jan 1, 2010
3.385 bln
-1.172 bln
-25.73%
jan 1, 2011
3.153 bln
-231.826 mln
-6.85%
jan 1, 2012
4.896 bln
+1.743 bln
55.27%
jan 1, 2013
4.873 bln
-22.861 mln
-0.47%
jan 1, 2014
5.033 bln
+160.532 mln
3.29%
jan 1, 2015
5.141 bln
+108.006 mln
2.15%
jan 1, 2016
4.198 bln
-943.134 mln
-18.34%
Ranking of countries by current statistics by years


Comments: