29
/
en
AIzaSyAYiBZKx7MnpbEhh9jyipgxe19OcubqV5w
April 1, 2024
184817
Madagascar
MDG
true
2
1
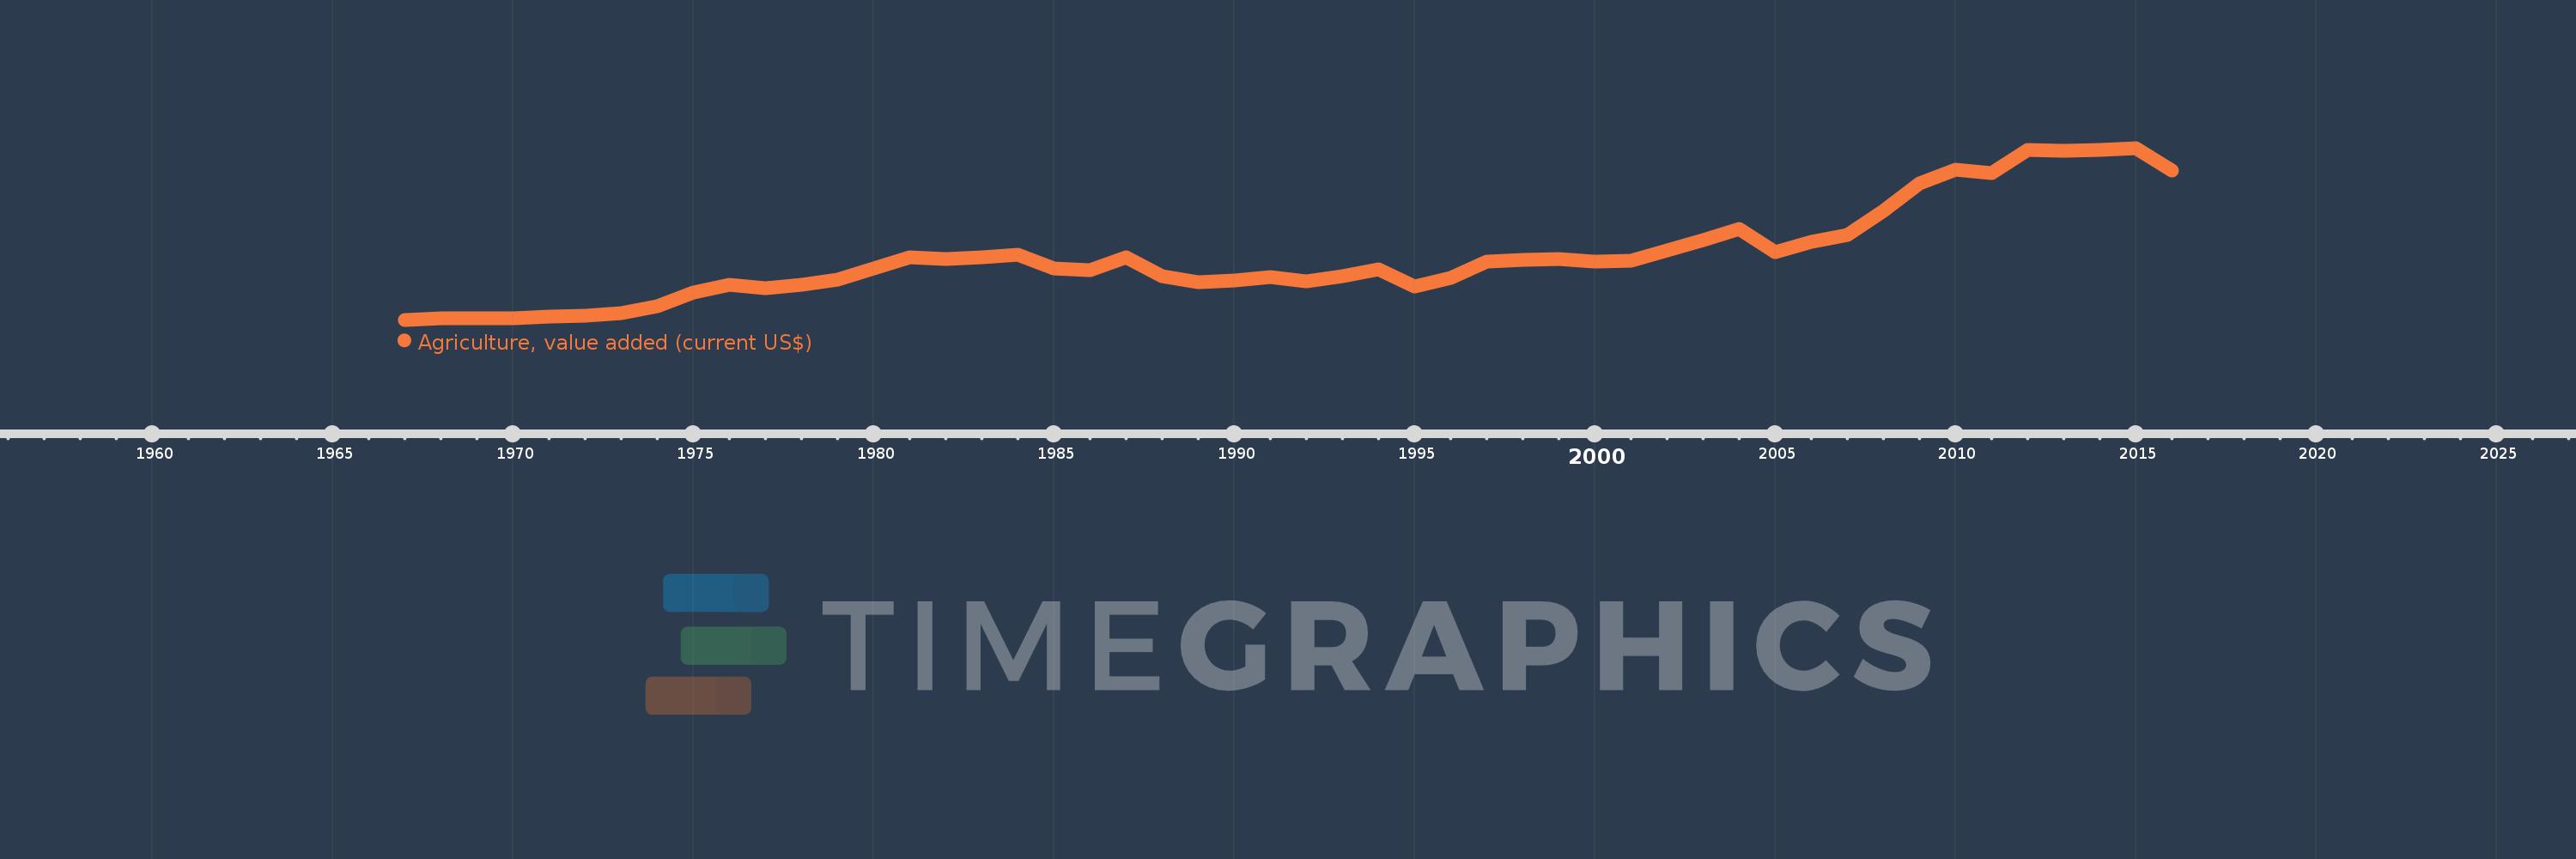
Agriculture, value added (current US$)
2016,2015,2014,2013,2012,2011,2010,2009,2008,2007,2006,2005,2004,2003,2002,2001,2000,1999,1998,1997,1996,1995,1994,1993,1992,1991,1990,1989,1988,1987,1986,1985,1984,1983,1982,1981,1980,1979,1978,1977,1976,1975,1974,1973,1972,1971,1970,1969,1968,1967
This statistics in other country:
AfghanistanAlbaniaAlgeriaAndorraAngolaAntigua and BarbudaArab WorldArgentinaArmeniaArubaAustraliaAustriaAzerbaijanBahamas, TheBahrainBangladeshBarbadosBelarusBelgiumBelizeBeninBermudaBhutanBoliviaBosnia and HerzegovinaBotswanaBrazilBrunei DarussalamBulgariaBurkina FasoBurundiCabo VerdeCambodiaCameroonCanadaCaribbean small statesCayman IslandsCentral African RepublicCentral Europe and the BalticsChadChileChinaColombiaComorosCongo, Dem. Rep.Congo, Rep.Costa RicaCote d'IvoireCroatiaCubaCyprusCzech RepublicDenmarkDjiboutiDominicaDominican RepublicEarly-demographic dividendEast Asia & PacificEast Asia & Pacific (excluding high income)East Asia & Pacific (IDA & IBRD countries)EcuadorEgypt, Arab Rep.El SalvadorEquatorial GuineaEritreaEstoniaEthiopiaEuro areaEurope & Central AsiaEurope & Central Asia (excluding high income)Europe & Central Asia (IDA & IBRD countries)European UnionFijiFinlandFragile and conflict affected situationsFranceFrench PolynesiaGabonGambia, TheGeorgiaGermanyGhanaGreeceGrenadaGuatemalaGuineaGuinea-BissauGuyanaHeavily indebted poor countries (HIPC)High incomeHondurasHong Kong SAR, ChinaHungaryIBRD onlyIcelandIDA & IBRD totalIDA blendIDA onlyIDA totalIndiaIndonesiaIran, Islamic Rep.IraqIrelandItalyJamaicaJapanJordanKazakhstanKenyaKiribatiKorea, Rep.KosovoKuwaitKyrgyz RepublicLao PDRLate-demographic dividendLatin America & Caribbean Latin America & Caribbean (excluding high income)Latin America & the Caribbean (IDA & IBRD countries)LatviaLeast developed countries: UN classificationLebanonLesothoLiberiaLibyaLithuaniaLow & middle incomeLow incomeLower middle incomeLuxembourgMacao SAR, ChinaMacedonia, FYRMadagascarMalawiMalaysiaMaldivesMaliMaltaMarshall IslandsMauritaniaMauritiusMexicoMicronesia, Fed. Sts.Middle East & North AfricaMiddle East & North Africa (excluding high income)Middle East & North Africa (IDA & IBRD countries)Middle incomeMoldovaMongoliaMontenegroMoroccoMozambiqueMyanmarNamibiaNepalNetherlandsNew CaledoniaNew ZealandNicaraguaNigerNigeriaNorth AmericaNorwayOECD membersOmanOther small statesPakistanPalauPanamaPapua New GuineaParaguayPeruPhilippinesPolandPortugalPost-demographic dividendPre-demographic dividendPuerto RicoQatarRomaniaRussian FederationRwandaSamoaSao Tome and PrincipeSaudi ArabiaSenegalSerbiaSeychellesSierra LeoneSingaporeSlovak RepublicSloveniaSmall statesSolomon IslandsSouth AfricaSouth AsiaSouth Asia (IDA & IBRD)SpainSri LankaSt. Kitts and NevisSt. LuciaSt. Vincent and the GrenadinesSub-Saharan Africa Sub-Saharan Africa (excluding high income)Sub-Saharan Africa (IDA & IBRD countries)SudanSurinameSwazilandSwedenSwitzerlandSyrian Arab RepublicTajikistanTanzaniaThailandTimor-LesteTogoTongaTrinidad and TobagoTunisiaTurkeyTurkmenistanTuvaluUgandaUkraineUnited Arab EmiratesUnited KingdomUnited StatesUpper middle incomeUruguayUzbekistanVanuatuVenezuela, RBVietnamWest Bank and GazaWorldYemen, Rep.ZambiaZimbabwe Timeline:
This timeline shows a graph from 1967 to 2016 of Madagascar. No data until 1966. Number of actual observations by date: 50.
Source name:
World Development Indicators
Source organization:
World Bank national accounts data, and OECD National Accounts data files.
Categories, topics:
Agriculture & Rural Development, Economy & Growth
Last updated:
apr 23, 2017
Indicators value changes by year
Minimum:
204.138 mln
jan 1, 1967
Maximum:
2.599 bln
jan 1, 2015
At the date of observation
Value
Absolute change
Change from previous value
jan 1, 1967
204.138 mln
+204.138 mln
0.0%
jan 1, 1968
218.587 mln
+14.449 mln
7.08%
jan 1, 1969
225.626 mln
+7.039 mln
3.22%
jan 1, 1970
226.078 mln
+451.34K
0.2%
jan 1, 1971
243.039 mln
+16.962 mln
7.5%
jan 1, 1972
258.066 mln
+15.027 mln
6.18%
jan 1, 1973
299.014 mln
+40.947 mln
15.87%
jan 1, 1974
394.728 mln
+95.714 mln
32.01%
jan 1, 1975
585.127 mln
+190.399 mln
48.24%
jan 1, 1976
693.028 mln
+107.902 mln
18.44%
jan 1, 1977
647.599 mln
-45.429 mln
-6.56%
jan 1, 1978
691.28 mln
+43.681 mln
6.75%
jan 1, 1979
760.324 mln
+69.044 mln
9.99%
jan 1, 1980
913.608 mln
+153.284 mln
20.16%
jan 1, 1981
1.078 bln
+164.665 mln
18.02%
jan 1, 1982
1.055 bln
-22.795 mln
-2.11%
jan 1, 1983
1.071 bln
+15.886 mln
1.51%
jan 1, 1984
1.115 bln
+44.082 mln
4.11%
jan 1, 1985
920.834 mln
-194.612 mln
-17.45%
jan 1, 1986
894.73 mln
-26.104 mln
-2.83%
jan 1, 1987
1.079 bln
+183.886 mln
20.55%
jan 1, 1988
809.861 mln
-268.754 mln
-24.92%
jan 1, 1989
725.325 mln
-84.536 mln
-10.44%
jan 1, 1990
748.657 mln
+23.331 mln
3.22%
jan 1, 1991
803.418 mln
+54.761 mln
7.31%
jan 1, 1992
739.424 mln
-63.994 mln
-7.97%
jan 1, 1993
809.135 mln
+69.711 mln
9.43%
jan 1, 1994
902.462 mln
+93.327 mln
11.53%
jan 1, 1995
665.458 mln
-237.004 mln
-26.26%
jan 1, 1996
783.621 mln
+118.163 mln
17.76%
jan 1, 1997
1.012 bln
+228.232 mln
29.13%
jan 1, 1998
1.034 bln
+22.608 mln
2.23%
jan 1, 1999
1.051 bln
+16.649 mln
1.61%
jan 1, 2000
1.013 bln
-37.983 mln
-3.61%
jan 1, 2001
1.026 bln
+13.163 mln
1.3%
jan 1, 2002
1.166 bln
+139.257 mln
13.57%
jan 1, 2003
1.312 bln
+146.314 mln
12.55%
jan 1, 2004
1.465 bln
+153.566 mln
11.71%
jan 1, 2005
1.143 bln
-322.891 mln
-22.03%
jan 1, 2006
1.294 bln
+151.567 mln
13.27%
jan 1, 2007
1.386 bln
+91.827 mln
7.1%
jan 1, 2008
1.718 bln
+331.872 mln
23.95%
jan 1, 2009
2.101 bln
+383.205 mln
22.31%
jan 1, 2010
2.295 bln
+194.187 mln
9.24%
jan 1, 2011
2.249 bln
-45.904 mln
-2.0%
jan 1, 2012
2.568 bln
+318.87 mln
14.18%
jan 1, 2013
2.557 bln
-11.61 mln
-0.45%
jan 1, 2014
2.576 bln
+18.992 mln
0.74%
jan 1, 2015
2.599 bln
+23.37 mln
0.91%
jan 1, 2016
2.289 bln
-310.368 mln
-11.94%
Ranking of countries by current statistics by years


Comments: