29
/
en
AIzaSyAYiBZKx7MnpbEhh9jyipgxe19OcubqV5w
April 1, 2024
221804
Peru
PER
true
2
1
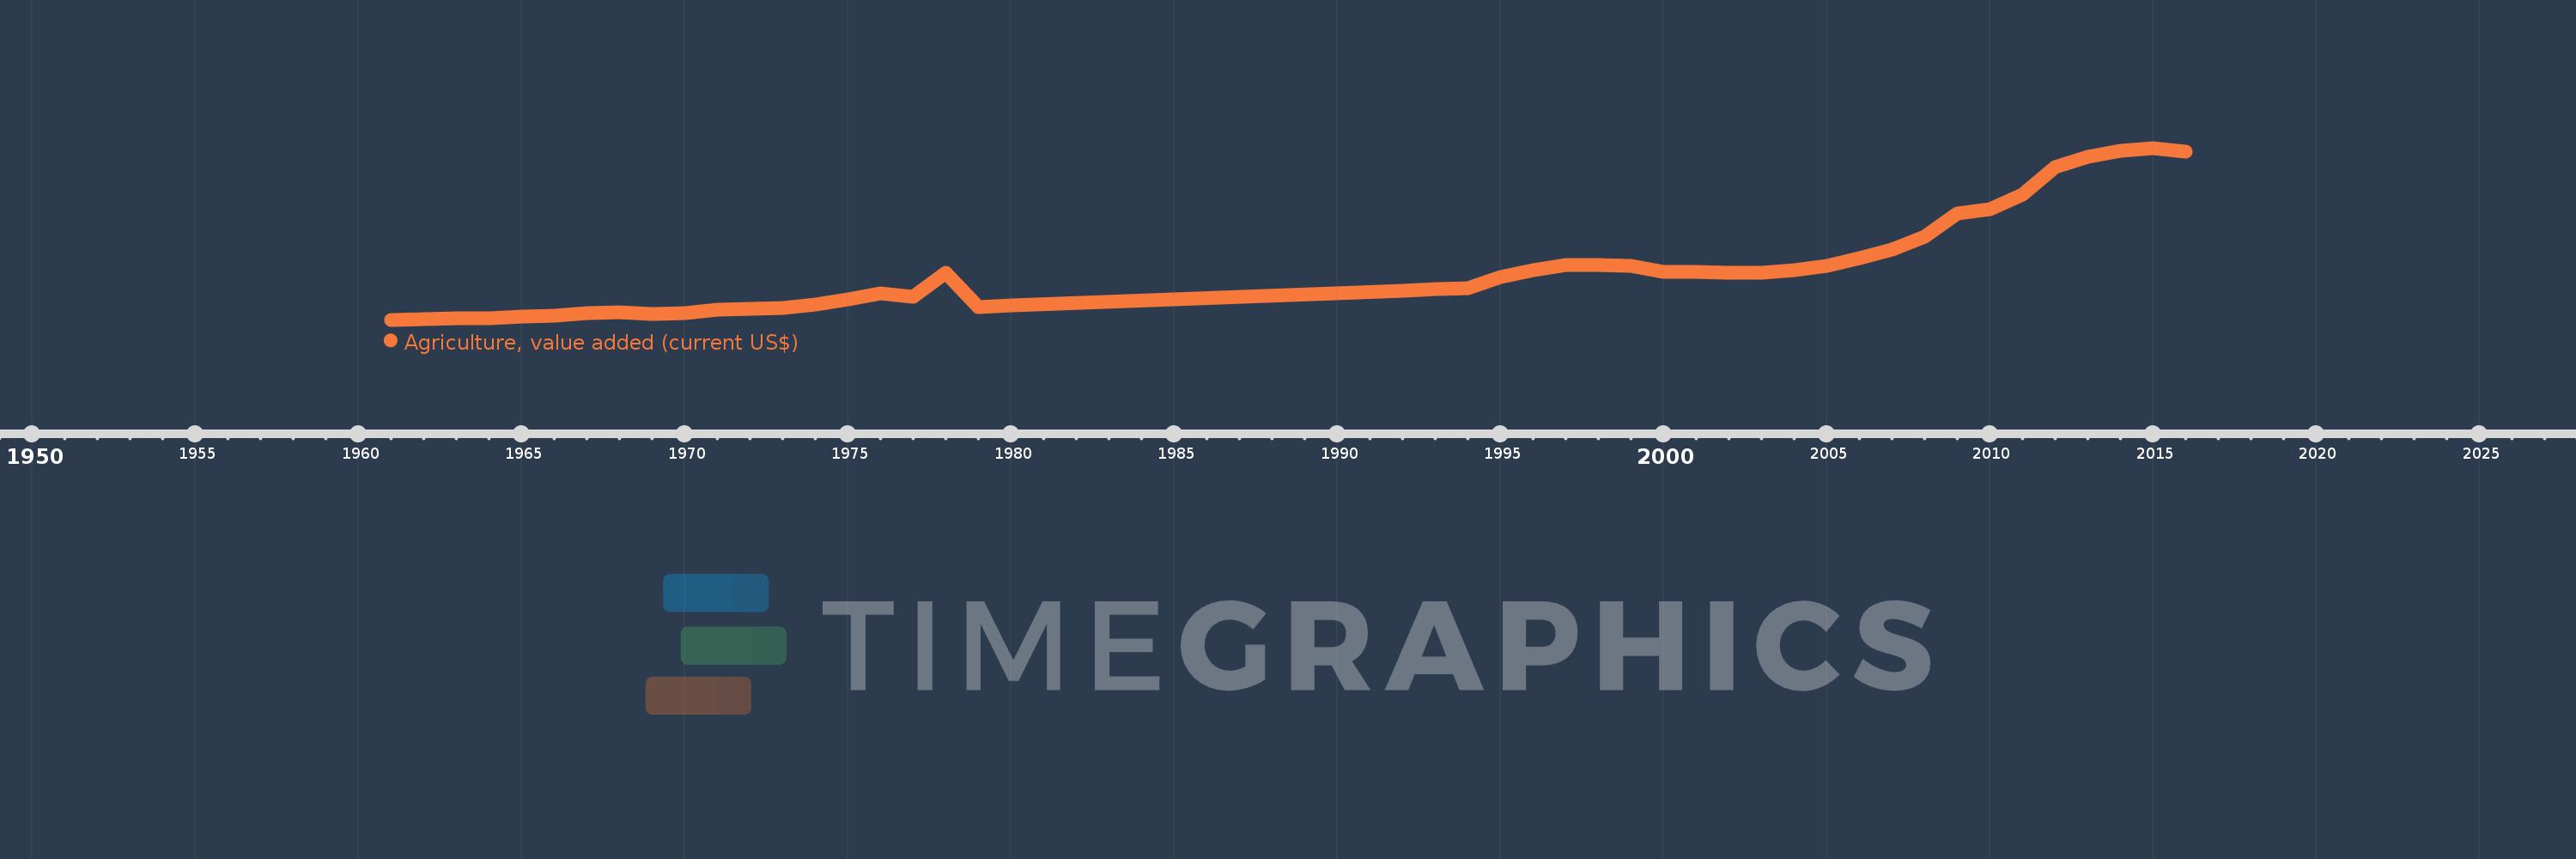
Agriculture, value added (current US$)
2016,2015,2014,2013,2012,2011,2010,2009,2008,2007,2006,2005,2004,2003,2002,2001,2000,1999,1998,1997,1996,1995,1994,1993,1992,1980,1979,1978,1977,1976,1975,1974,1973,1972,1971,1970,1969,1968,1967,1966,1965,1964,1963,1962,1961
This statistics in other country:
AfghanistanAlbaniaAlgeriaAndorraAngolaAntigua and BarbudaArab WorldArgentinaArmeniaArubaAustraliaAustriaAzerbaijanBahamas, TheBahrainBangladeshBarbadosBelarusBelgiumBelizeBeninBermudaBhutanBoliviaBosnia and HerzegovinaBotswanaBrazilBrunei DarussalamBulgariaBurkina FasoBurundiCabo VerdeCambodiaCameroonCanadaCaribbean small statesCayman IslandsCentral African RepublicCentral Europe and the BalticsChadChileChinaColombiaComorosCongo, Dem. Rep.Congo, Rep.Costa RicaCote d'IvoireCroatiaCubaCyprusCzech RepublicDenmarkDjiboutiDominicaDominican RepublicEarly-demographic dividendEast Asia & PacificEast Asia & Pacific (excluding high income)East Asia & Pacific (IDA & IBRD countries)EcuadorEgypt, Arab Rep.El SalvadorEquatorial GuineaEritreaEstoniaEthiopiaEuro areaEurope & Central AsiaEurope & Central Asia (excluding high income)Europe & Central Asia (IDA & IBRD countries)European UnionFijiFinlandFragile and conflict affected situationsFranceFrench PolynesiaGabonGambia, TheGeorgiaGermanyGhanaGreeceGrenadaGuatemalaGuineaGuinea-BissauGuyanaHeavily indebted poor countries (HIPC)High incomeHondurasHong Kong SAR, ChinaHungaryIBRD onlyIcelandIDA & IBRD totalIDA blendIDA onlyIDA totalIndiaIndonesiaIran, Islamic Rep.IraqIrelandItalyJamaicaJapanJordanKazakhstanKenyaKiribatiKorea, Rep.KosovoKuwaitKyrgyz RepublicLao PDRLate-demographic dividendLatin America & Caribbean Latin America & Caribbean (excluding high income)Latin America & the Caribbean (IDA & IBRD countries)LatviaLeast developed countries: UN classificationLebanonLesothoLiberiaLibyaLithuaniaLow & middle incomeLow incomeLower middle incomeLuxembourgMacao SAR, ChinaMacedonia, FYRMadagascarMalawiMalaysiaMaldivesMaliMaltaMarshall IslandsMauritaniaMauritiusMexicoMicronesia, Fed. Sts.Middle East & North AfricaMiddle East & North Africa (excluding high income)Middle East & North Africa (IDA & IBRD countries)Middle incomeMoldovaMongoliaMontenegroMoroccoMozambiqueMyanmarNamibiaNepalNetherlandsNew CaledoniaNew ZealandNicaraguaNigerNigeriaNorth AmericaNorwayOECD membersOmanOther small statesPakistanPalauPanamaPapua New GuineaParaguayPeruPhilippinesPolandPortugalPost-demographic dividendPre-demographic dividendPuerto RicoQatarRomaniaRussian FederationRwandaSamoaSao Tome and PrincipeSaudi ArabiaSenegalSerbiaSeychellesSierra LeoneSingaporeSlovak RepublicSloveniaSmall statesSolomon IslandsSouth AfricaSouth AsiaSouth Asia (IDA & IBRD)SpainSri LankaSt. Kitts and NevisSt. LuciaSt. Vincent and the GrenadinesSub-Saharan Africa Sub-Saharan Africa (excluding high income)Sub-Saharan Africa (IDA & IBRD countries)SudanSurinameSwazilandSwedenSwitzerlandSyrian Arab RepublicTajikistanTanzaniaThailandTimor-LesteTogoTongaTrinidad and TobagoTunisiaTurkeyTurkmenistanTuvaluUgandaUkraineUnited Arab EmiratesUnited KingdomUnited StatesUpper middle incomeUruguayUzbekistanVanuatuVenezuela, RBVietnamWest Bank and GazaWorldYemen, Rep.ZambiaZimbabwe Timeline:
This timeline shows a graph from 1961 to 2016 of Peru. No data until 1960. Number of actual observations by date: 45.
Source name:
World Development Indicators
Source organization:
World Bank national accounts data, and OECD National Accounts data files.
Categories, topics:
Agriculture & Rural Development, Economy & Growth
Last updated:
apr 23, 2017
Indicators value changes by year
Minimum:
490.065 mln
jan 1, 1961
Maximum:
13.657 bln
jan 1, 2015
At the date of observation
Value
Absolute change
Change from previous value
jan 1, 1961
490.065 mln
+490.065 mln
0.0%
jan 1, 1962
555.468 mln
+65.403 mln
13.35%
jan 1, 1963
597.146 mln
+41.678 mln
7.5%
jan 1, 1964
615.176 mln
+18.029 mln
3.02%
jan 1, 1965
719.216 mln
+104.04 mln
16.91%
jan 1, 1966
830.639 mln
+111.423 mln
15.49%
jan 1, 1967
987.763 mln
+157.123 mln
18.92%
jan 1, 1968
1.044 bln
+56.567 mln
5.73%
jan 1, 1969
958.485 mln
-85.844 mln
-8.22%
jan 1, 1970
1.027 bln
+68.928 mln
7.19%
jan 1, 1971
1.242 bln
+214.929 mln
20.92%
jan 1, 1972
1.323 bln
+80.721 mln
6.5%
jan 1, 1973
1.38 bln
+57.24 mln
4.33%
jan 1, 1974
1.635 bln
+255.023 mln
18.48%
jan 1, 1975
2.025 bln
+389.399 mln
23.81%
jan 1, 1976
2.504 bln
+479.489 mln
23.68%
jan 1, 1977
2.228 bln
-276.482 mln
-11.04%
jan 1, 1978
4.085 bln
+1.858 bln
83.39%
jan 1, 1979
1.457 bln
-2.629 bln
-64.34%
jan 1, 1980
1.56 bln
+103.484 mln
7.1%
jan 1, 1992
2.7 bln
+1.14 bln
73.05%
jan 1, 1993
2.812 bln
+111.802 mln
4.14%
jan 1, 1994
2.888 bln
+76.287 mln
2.71%
jan 1, 1995
3.777 bln
+888.939 mln
30.78%
jan 1, 1996
4.285 bln
+508.308 mln
13.46%
jan 1, 1997
4.699 bln
+413.294 mln
9.64%
jan 1, 1998
4.68 bln
-18.887 mln
-0.4%
jan 1, 1999
4.65 bln
-29.706 mln
-0.63%
jan 1, 2000
4.148 bln
-502.367 mln
-10.8%
jan 1, 2001
4.175 bln
+27.745 mln
0.67%
jan 1, 2002
4.107 bln
-68.411 mln
-1.64%
jan 1, 2003
4.121 bln
+14.376 mln
0.35%
jan 1, 2004
4.295 bln
+173.51 mln
4.21%
jan 1, 2005
4.63 bln
+335.078 mln
7.8%
jan 1, 2006
5.213 bln
+583.364 mln
12.6%
jan 1, 2007
5.854 bln
+640.144 mln
12.28%
jan 1, 2008
6.851 bln
+997.851 mln
17.05%
jan 1, 2009
8.633 bln
+1.781 bln
26.0%
jan 1, 2010
8.946 bln
+313.064 mln
3.63%
jan 1, 2011
10.071 bln
+1.125 bln
12.58%
jan 1, 2012
12.193 bln
+2.122 bln
21.07%
jan 1, 2013
12.953 bln
+760.534 mln
6.24%
jan 1, 2014
13.411 bln
+457.387 mln
3.53%
jan 1, 2015
13.657 bln
+246.221 mln
1.84%
jan 1, 2016
13.348 bln
-308.778 mln
-2.26%
Ranking of countries by current statistics by years


Comments: