29
/
en
AIzaSyAYiBZKx7MnpbEhh9jyipgxe19OcubqV5w
April 1, 2024
147637
Guyana
GUY
true
2
1
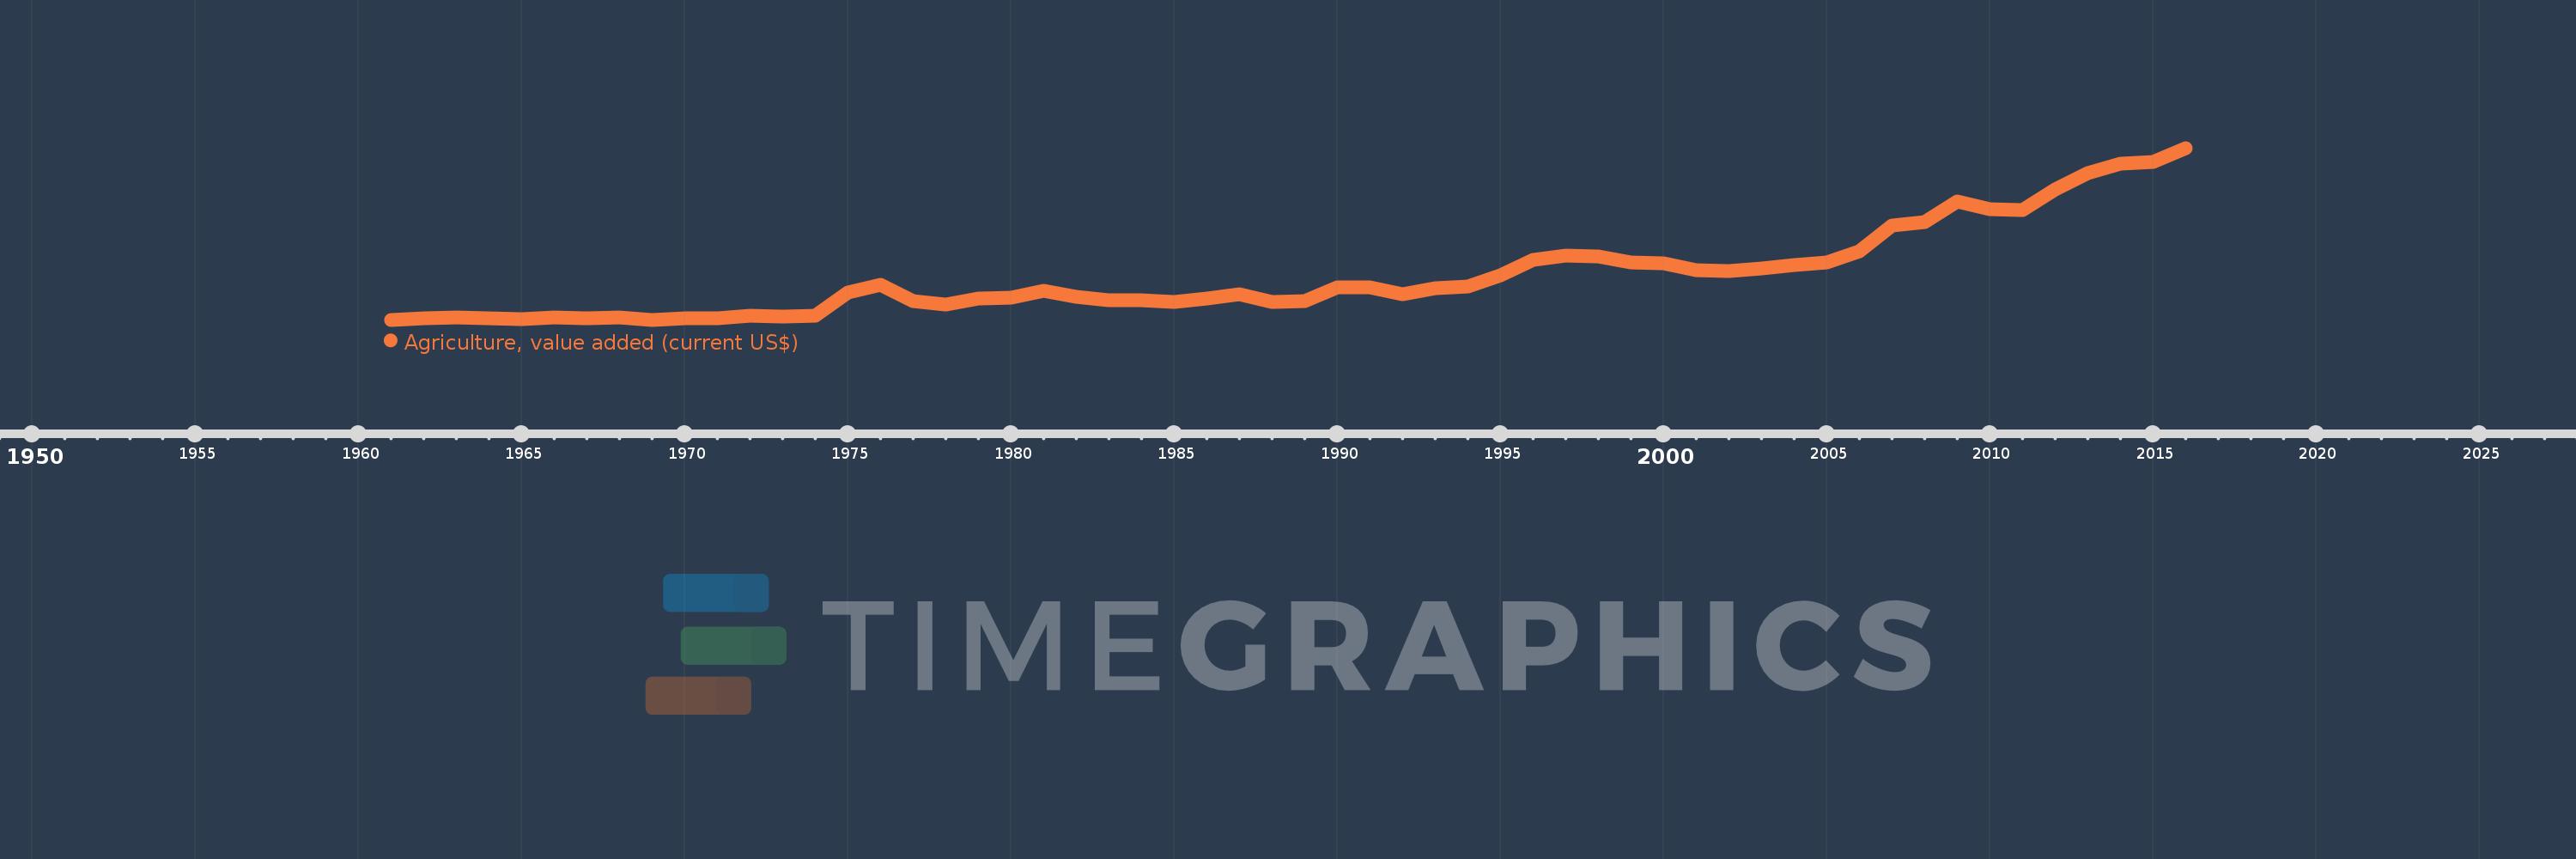
Agriculture, value added (current US$)
2016,2015,2014,2013,2012,2011,2010,2009,2008,2007,2006,2005,2004,2003,2002,2001,2000,1999,1998,1997,1996,1995,1994,1993,1992,1991,1990,1989,1988,1987,1986,1985,1984,1983,1982,1981,1980,1979,1978,1977,1976,1975,1974,1973,1972,1971,1970,1969,1968,1967,1966,1965,1964,1963,1962,1961
This statistics in other country:
AfghanistanAlbaniaAlgeriaAndorraAngolaAntigua and BarbudaArab WorldArgentinaArmeniaArubaAustraliaAustriaAzerbaijanBahamas, TheBahrainBangladeshBarbadosBelarusBelgiumBelizeBeninBermudaBhutanBoliviaBosnia and HerzegovinaBotswanaBrazilBrunei DarussalamBulgariaBurkina FasoBurundiCabo VerdeCambodiaCameroonCanadaCaribbean small statesCayman IslandsCentral African RepublicCentral Europe and the BalticsChadChileChinaColombiaComorosCongo, Dem. Rep.Congo, Rep.Costa RicaCote d'IvoireCroatiaCubaCyprusCzech RepublicDenmarkDjiboutiDominicaDominican RepublicEarly-demographic dividendEast Asia & PacificEast Asia & Pacific (excluding high income)East Asia & Pacific (IDA & IBRD countries)EcuadorEgypt, Arab Rep.El SalvadorEquatorial GuineaEritreaEstoniaEthiopiaEuro areaEurope & Central AsiaEurope & Central Asia (excluding high income)Europe & Central Asia (IDA & IBRD countries)European UnionFijiFinlandFragile and conflict affected situationsFranceFrench PolynesiaGabonGambia, TheGeorgiaGermanyGhanaGreeceGrenadaGuatemalaGuineaGuinea-BissauGuyanaHeavily indebted poor countries (HIPC)High incomeHondurasHong Kong SAR, ChinaHungaryIBRD onlyIcelandIDA & IBRD totalIDA blendIDA onlyIDA totalIndiaIndonesiaIran, Islamic Rep.IraqIrelandItalyJamaicaJapanJordanKazakhstanKenyaKiribatiKorea, Rep.KosovoKuwaitKyrgyz RepublicLao PDRLate-demographic dividendLatin America & Caribbean Latin America & Caribbean (excluding high income)Latin America & the Caribbean (IDA & IBRD countries)LatviaLeast developed countries: UN classificationLebanonLesothoLiberiaLibyaLithuaniaLow & middle incomeLow incomeLower middle incomeLuxembourgMacao SAR, ChinaMacedonia, FYRMadagascarMalawiMalaysiaMaldivesMaliMaltaMarshall IslandsMauritaniaMauritiusMexicoMicronesia, Fed. Sts.Middle East & North AfricaMiddle East & North Africa (excluding high income)Middle East & North Africa (IDA & IBRD countries)Middle incomeMoldovaMongoliaMontenegroMoroccoMozambiqueMyanmarNamibiaNepalNetherlandsNew CaledoniaNew ZealandNicaraguaNigerNigeriaNorth AmericaNorwayOECD membersOmanOther small statesPakistanPalauPanamaPapua New GuineaParaguayPeruPhilippinesPolandPortugalPost-demographic dividendPre-demographic dividendPuerto RicoQatarRomaniaRussian FederationRwandaSamoaSao Tome and PrincipeSaudi ArabiaSenegalSerbiaSeychellesSierra LeoneSingaporeSlovak RepublicSloveniaSmall statesSolomon IslandsSouth AfricaSouth AsiaSouth Asia (IDA & IBRD)SpainSri LankaSt. Kitts and NevisSt. LuciaSt. Vincent and the GrenadinesSub-Saharan Africa Sub-Saharan Africa (excluding high income)Sub-Saharan Africa (IDA & IBRD countries)SudanSurinameSwazilandSwedenSwitzerlandSyrian Arab RepublicTajikistanTanzaniaThailandTimor-LesteTogoTongaTrinidad and TobagoTunisiaTurkeyTurkmenistanTuvaluUgandaUkraineUnited Arab EmiratesUnited KingdomUnited StatesUpper middle incomeUruguayUzbekistanVanuatuVenezuela, RBVietnamWest Bank and GazaWorldYemen, Rep.ZambiaZimbabwe Timeline:
This timeline shows a graph from 1961 to 2016 of Guyana. No data until 1960. Number of actual observations by date: 56.
Source name:
World Development Indicators
Source organization:
World Bank national accounts data, and OECD National Accounts data files.
Categories, topics:
Agriculture & Rural Development, Economy & Growth
Last updated:
apr 23, 2017
Indicators value changes by year
Minimum:
39.9 mln
jan 1, 1969
Maximum:
540.324 mln
jan 1, 2016
At the date of observation
Value
Absolute change
Change from previous value
jan 1, 1961
40.133 mln
+40.133 mln
0.0%
jan 1, 1962
44.333 mln
+4.2 mln
10.47%
jan 1, 1963
45.733 mln
+1.4 mln
3.16%
jan 1, 1964
42.991 mln
-2.742 mln
-5.99%
jan 1, 1965
42.758 mln
-233.331K
-0.54%
jan 1, 1966
46.0 mln
+3.242 mln
7.58%
jan 1, 1967
43.647 mln
-2.353 mln
-5.12%
jan 1, 1968
47.118 mln
+3.471 mln
7.95%
jan 1, 1969
39.9 mln
-7.218 mln
-15.32%
jan 1, 1970
44.7 mln
+4.8 mln
12.03%
jan 1, 1971
45.05 mln
+350.0K
0.78%
jan 1, 1972
50.85 mln
+5.8 mln
12.87%
jan 1, 1973
49.619 mln
-1.231 mln
-2.42%
jan 1, 1974
50.619 mln
+1000.0K
2.02%
jan 1, 1975
120.045 mln
+69.426 mln
137.15%
jan 1, 1976
142.25 mln
+22.205 mln
18.5%
jan 1, 1977
94.4 mln
-47.85 mln
-33.64%
jan 1, 1978
84.32 mln
-10.08 mln
-10.68%
jan 1, 1979
102.64 mln
+18.32 mln
21.73%
jan 1, 1980
105.4 mln
+2.76 mln
2.69%
jan 1, 1981
124.8 mln
+19.4 mln
18.41%
jan 1, 1982
107.143 mln
-17.657 mln
-14.15%
jan 1, 1983
97.333 mln
-9.81 mln
-9.16%
jan 1, 1984
97.0 mln
-333.333K
-0.34%
jan 1, 1985
91.316 mln
-5.684 mln
-5.86%
jan 1, 1986
102.093 mln
+10.777 mln
11.8%
jan 1, 1987
113.953 mln
+11.86 mln
11.62%
jan 1, 1988
91.735 mln
-22.219 mln
-19.5%
jan 1, 1989
93.6 mln
+1.865 mln
2.03%
jan 1, 1990
133.162 mln
+39.562 mln
42.27%
jan 1, 1991
133.19 mln
+28.11K
0.02%
jan 1, 1992
115.411 mln
-17.778 mln
-13.35%
jan 1, 1993
131.583 mln
+16.171 mln
14.01%
jan 1, 1994
137.535 mln
+5.952 mln
4.52%
jan 1, 1995
168.886 mln
+31.352 mln
22.8%
jan 1, 1996
214.655 mln
+45.768 mln
27.1%
jan 1, 1997
227.87 mln
+13.215 mln
6.16%
jan 1, 1998
223.404 mln
-4.466 mln
-1.96%
jan 1, 1999
208.007 mln
-15.397 mln
-6.89%
jan 1, 2000
204.525 mln
-3.482 mln
-1.67%
jan 1, 2001
184.191 mln
-20.334 mln
-9.94%
jan 1, 2002
181.539 mln
-2.652 mln
-1.44%
jan 1, 2003
190.376 mln
+8.837 mln
4.87%
jan 1, 2004
199.862 mln
+9.487 mln
4.98%
jan 1, 2005
206.063 mln
+6.2 mln
3.1%
jan 1, 2006
238.274 mln
+32.211 mln
15.63%
jan 1, 2007
313.6 mln
+75.326 mln
31.61%
jan 1, 2008
323.237 mln
+9.638 mln
3.07%
jan 1, 2009
384.839 mln
+61.602 mln
19.06%
jan 1, 2010
362.604 mln
-22.235 mln
-5.78%
jan 1, 2011
359.868 mln
-2.736 mln
-0.75%
jan 1, 2012
420.493 mln
+60.625 mln
16.85%
jan 1, 2013
467.625 mln
+47.131 mln
11.21%
jan 1, 2014
494.43 mln
+26.805 mln
5.73%
jan 1, 2015
499.537 mln
+5.107 mln
1.03%
jan 1, 2016
540.324 mln
+40.788 mln
8.17%
Ranking of countries by current statistics by years


Comments: