29
/
en
AIzaSyAYiBZKx7MnpbEhh9jyipgxe19OcubqV5w
April 1, 2024
23897
Arab World
ARB
false
2
1
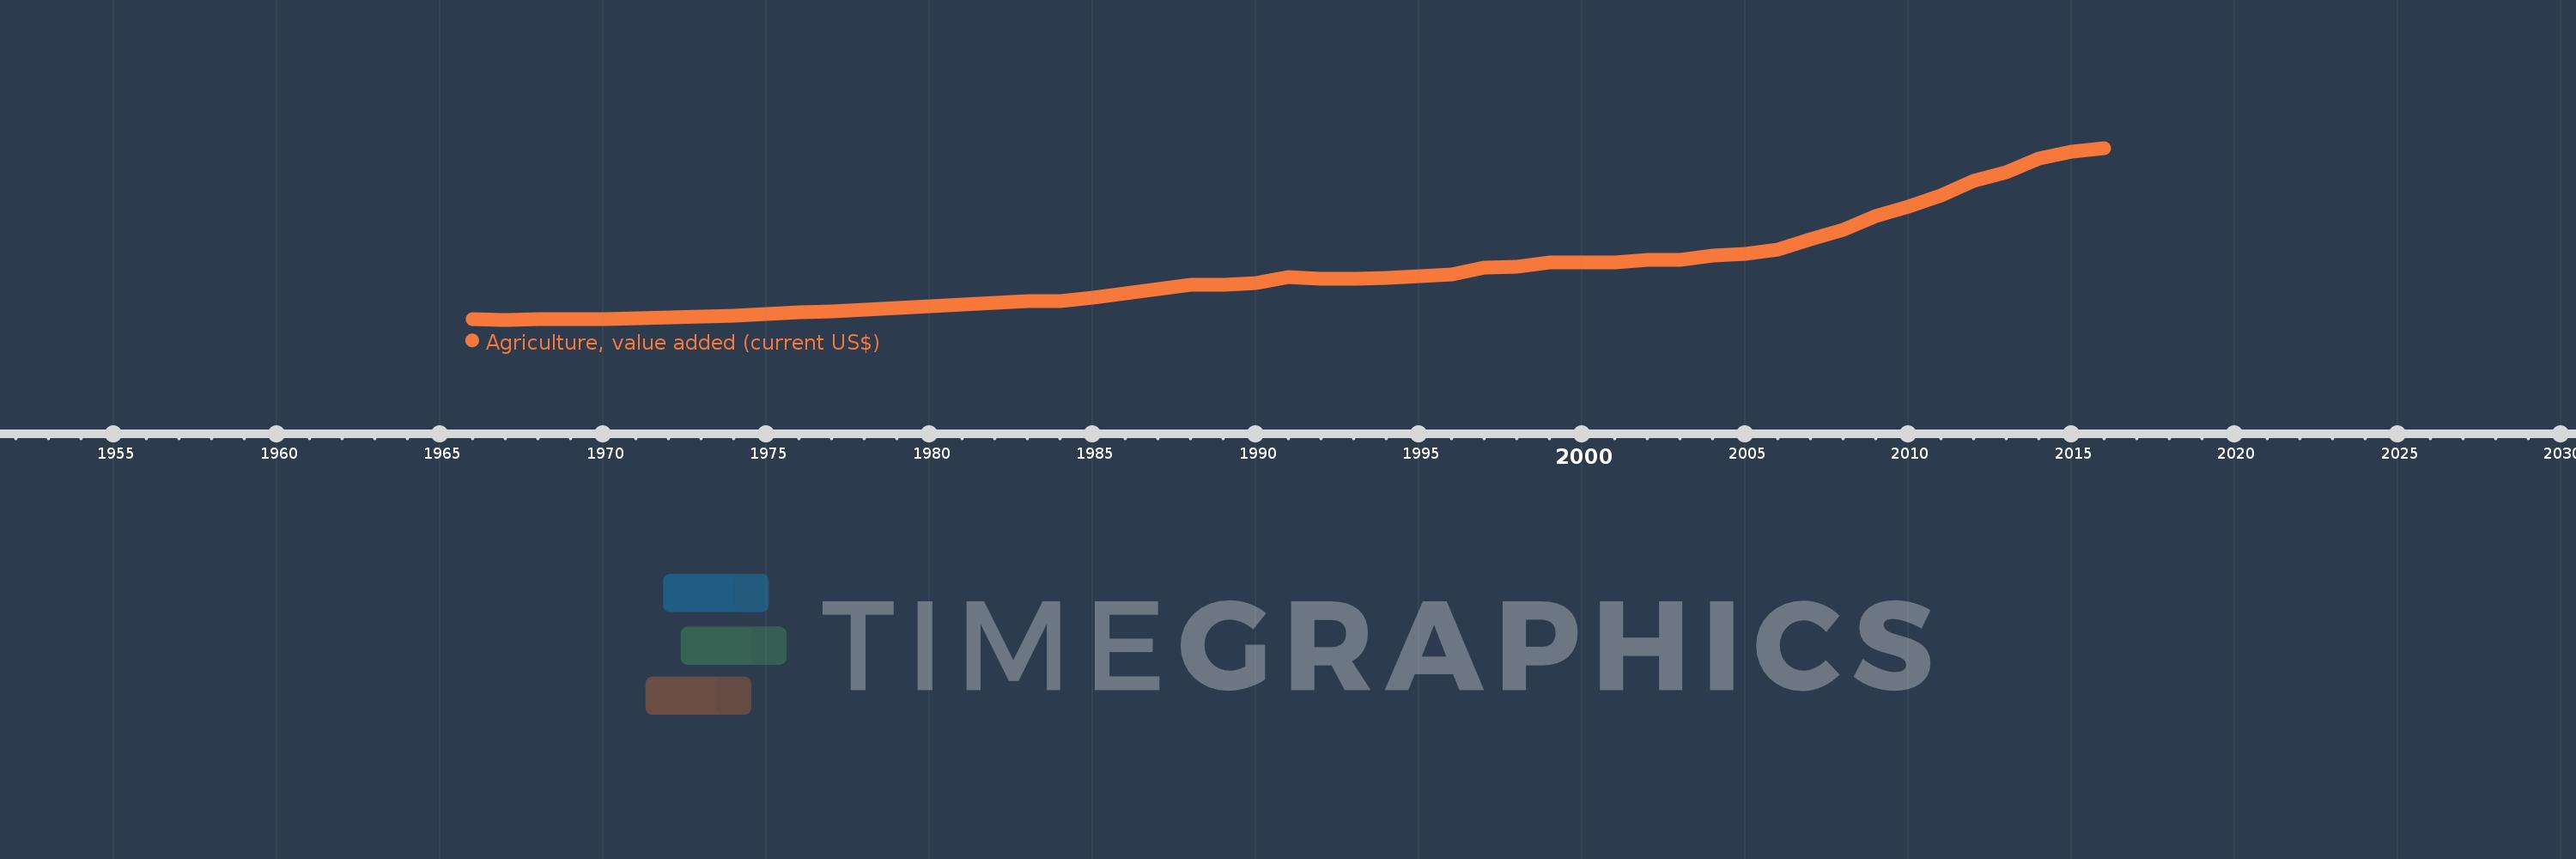
Agriculture, value added (current US$)
2016,2015,2014,2013,2012,2011,2010,2009,2008,2007,2006,2005,2004,2003,2002,2001,2000,1999,1998,1997,1996,1995,1994,1993,1992,1991,1990,1989,1988,1987,1986,1985,1984,1983,1982,1981,1980,1979,1978,1977,1976,1975,1974,1973,1972,1971,1970,1969,1968,1967,1966
This statistics in other country:
AfghanistanAlbaniaAlgeriaAndorraAngolaAntigua and BarbudaArab WorldArgentinaArmeniaArubaAustraliaAustriaAzerbaijanBahamas, TheBahrainBangladeshBarbadosBelarusBelgiumBelizeBeninBermudaBhutanBoliviaBosnia and HerzegovinaBotswanaBrazilBrunei DarussalamBulgariaBurkina FasoBurundiCabo VerdeCambodiaCameroonCanadaCaribbean small statesCayman IslandsCentral African RepublicCentral Europe and the BalticsChadChileChinaColombiaComorosCongo, Dem. Rep.Congo, Rep.Costa RicaCote d'IvoireCroatiaCubaCyprusCzech RepublicDenmarkDjiboutiDominicaDominican RepublicEarly-demographic dividendEast Asia & PacificEast Asia & Pacific (excluding high income)East Asia & Pacific (IDA & IBRD countries)EcuadorEgypt, Arab Rep.El SalvadorEquatorial GuineaEritreaEstoniaEthiopiaEuro areaEurope & Central AsiaEurope & Central Asia (excluding high income)Europe & Central Asia (IDA & IBRD countries)European UnionFijiFinlandFragile and conflict affected situationsFranceFrench PolynesiaGabonGambia, TheGeorgiaGermanyGhanaGreeceGrenadaGuatemalaGuineaGuinea-BissauGuyanaHeavily indebted poor countries (HIPC)High incomeHondurasHong Kong SAR, ChinaHungaryIBRD onlyIcelandIDA & IBRD totalIDA blendIDA onlyIDA totalIndiaIndonesiaIran, Islamic Rep.IraqIrelandItalyJamaicaJapanJordanKazakhstanKenyaKiribatiKorea, Rep.KosovoKuwaitKyrgyz RepublicLao PDRLate-demographic dividendLatin America & Caribbean Latin America & Caribbean (excluding high income)Latin America & the Caribbean (IDA & IBRD countries)LatviaLeast developed countries: UN classificationLebanonLesothoLiberiaLibyaLithuaniaLow & middle incomeLow incomeLower middle incomeLuxembourgMacao SAR, ChinaMacedonia, FYRMadagascarMalawiMalaysiaMaldivesMaliMaltaMarshall IslandsMauritaniaMauritiusMexicoMicronesia, Fed. Sts.Middle East & North AfricaMiddle East & North Africa (excluding high income)Middle East & North Africa (IDA & IBRD countries)Middle incomeMoldovaMongoliaMontenegroMoroccoMozambiqueMyanmarNamibiaNepalNetherlandsNew CaledoniaNew ZealandNicaraguaNigerNigeriaNorth AmericaNorwayOECD membersOmanOther small statesPakistanPalauPanamaPapua New GuineaParaguayPeruPhilippinesPolandPortugalPost-demographic dividendPre-demographic dividendPuerto RicoQatarRomaniaRussian FederationRwandaSamoaSao Tome and PrincipeSaudi ArabiaSenegalSerbiaSeychellesSierra LeoneSingaporeSlovak RepublicSloveniaSmall statesSolomon IslandsSouth AfricaSouth AsiaSouth Asia (IDA & IBRD)SpainSri LankaSt. Kitts and NevisSt. LuciaSt. Vincent and the GrenadinesSub-Saharan Africa Sub-Saharan Africa (excluding high income)Sub-Saharan Africa (IDA & IBRD countries)SudanSurinameSwazilandSwedenSwitzerlandSyrian Arab RepublicTajikistanTanzaniaThailandTimor-LesteTogoTongaTrinidad and TobagoTunisiaTurkeyTurkmenistanTuvaluUgandaUkraineUnited Arab EmiratesUnited KingdomUnited StatesUpper middle incomeUruguayUzbekistanVanuatuVenezuela, RBVietnamWest Bank and GazaWorldYemen, Rep.ZambiaZimbabwe Timeline:
This timeline shows a graph from 1966 to 2016 of Arab World. No data until 1965. Number of actual observations by date: 51.
Source name:
World Development Indicators
Source organization:
World Bank national accounts data, and OECD National Accounts data files.
Categories, topics:
Agriculture & Rural Development, Economy & Growth
Last updated:
apr 23, 2017
Indicators value changes by year
Minimum:
3.405 bln
jan 1, 1967
Maximum:
157.814 bln
jan 1, 2016
At the date of observation
Value
Absolute change
Change from previous value
jan 1, 1966
3.77 bln
+3.77 bln
0.0%
jan 1, 1967
3.405 bln
-364.985 mln
-9.68%
jan 1, 1968
3.706 bln
+300.515 mln
8.82%
jan 1, 1969
4.017 bln
+311.472 mln
8.4%
jan 1, 1970
4.254 bln
+236.522 mln
5.89%
jan 1, 1971
4.813 bln
+559.507 mln
13.15%
jan 1, 1972
5.371 bln
+557.653 mln
11.59%
jan 1, 1973
6.292 bln
+921.323 mln
17.15%
jan 1, 1974
7.127 bln
+834.564 mln
13.26%
jan 1, 1975
8.455 bln
+1.328 bln
18.64%
jan 1, 1976
9.866 bln
+1.411 bln
16.69%
jan 1, 1977
11.251 bln
+1.384 bln
14.03%
jan 1, 1978
12.566 bln
+1.316 bln
11.69%
jan 1, 1979
13.848 bln
+1.281 bln
10.2%
jan 1, 1980
15.494 bln
+1.646 bln
11.89%
jan 1, 1981
17.158 bln
+1.664 bln
10.74%
jan 1, 1982
18.569 bln
+1.411 bln
8.22%
jan 1, 1983
20.359 bln
+1.79 bln
9.64%
jan 1, 1984
20.538 bln
+179.843 mln
0.88%
jan 1, 1985
23.279 bln
+2.74 bln
13.34%
jan 1, 1986
27.382 bln
+4.104 bln
17.63%
jan 1, 1987
30.867 bln
+3.485 bln
12.73%
jan 1, 1988
35.113 bln
+4.246 bln
13.76%
jan 1, 1989
34.807 bln
-305.866 mln
-0.87%
jan 1, 1990
36.626 bln
+1.819 bln
5.23%
jan 1, 1991
42.125 bln
+5.499 bln
15.02%
jan 1, 1992
40.605 bln
-1.521 bln
-3.61%
jan 1, 1993
40.517 bln
-87.999 mln
-0.22%
jan 1, 1994
41.221 bln
+704.15 mln
1.74%
jan 1, 1995
42.34 bln
+1.119 bln
2.71%
jan 1, 1996
44.477 bln
+2.137 bln
5.05%
jan 1, 1997
50.406 bln
+5.929 bln
13.33%
jan 1, 1998
50.666 bln
+259.502 mln
0.51%
jan 1, 1999
55.157 bln
+4.492 bln
8.87%
jan 1, 2000
54.616 bln
-540.856 mln
-0.98%
jan 1, 2001
55.241 bln
+624.555 mln
1.14%
jan 1, 2002
57.453 bln
+2.212 bln
4.0%
jan 1, 2003
56.981 bln
-472.213 mln
-0.82%
jan 1, 2004
60.699 bln
+3.718 bln
6.53%
jan 1, 2005
62.947 bln
+2.248 bln
3.7%
jan 1, 2006
66.778 bln
+3.831 bln
6.09%
jan 1, 2007
75.84 bln
+9.062 bln
13.57%
jan 1, 2008
84.403 bln
+8.563 bln
11.29%
jan 1, 2009
96.246 bln
+11.842 bln
14.03%
jan 1, 2010
104.932 bln
+8.686 bln
9.02%
jan 1, 2011
115.179 bln
+10.248 bln
9.77%
jan 1, 2012
127.956 bln
+12.777 bln
11.09%
jan 1, 2013
136.242 bln
+8.286 bln
6.48%
jan 1, 2014
148.324 bln
+12.081 bln
8.87%
jan 1, 2015
154.224 bln
+5.9 bln
3.98%
jan 1, 2016
157.814 bln
+3.59 bln
2.33%
Ranking of countries by current statistics by years


Comments: