29
/
en
AIzaSyAYiBZKx7MnpbEhh9jyipgxe19OcubqV5w
April 1, 2024
32388
Europe & Central Asia (IDA & IBRD countries)
TEC
false
2
1
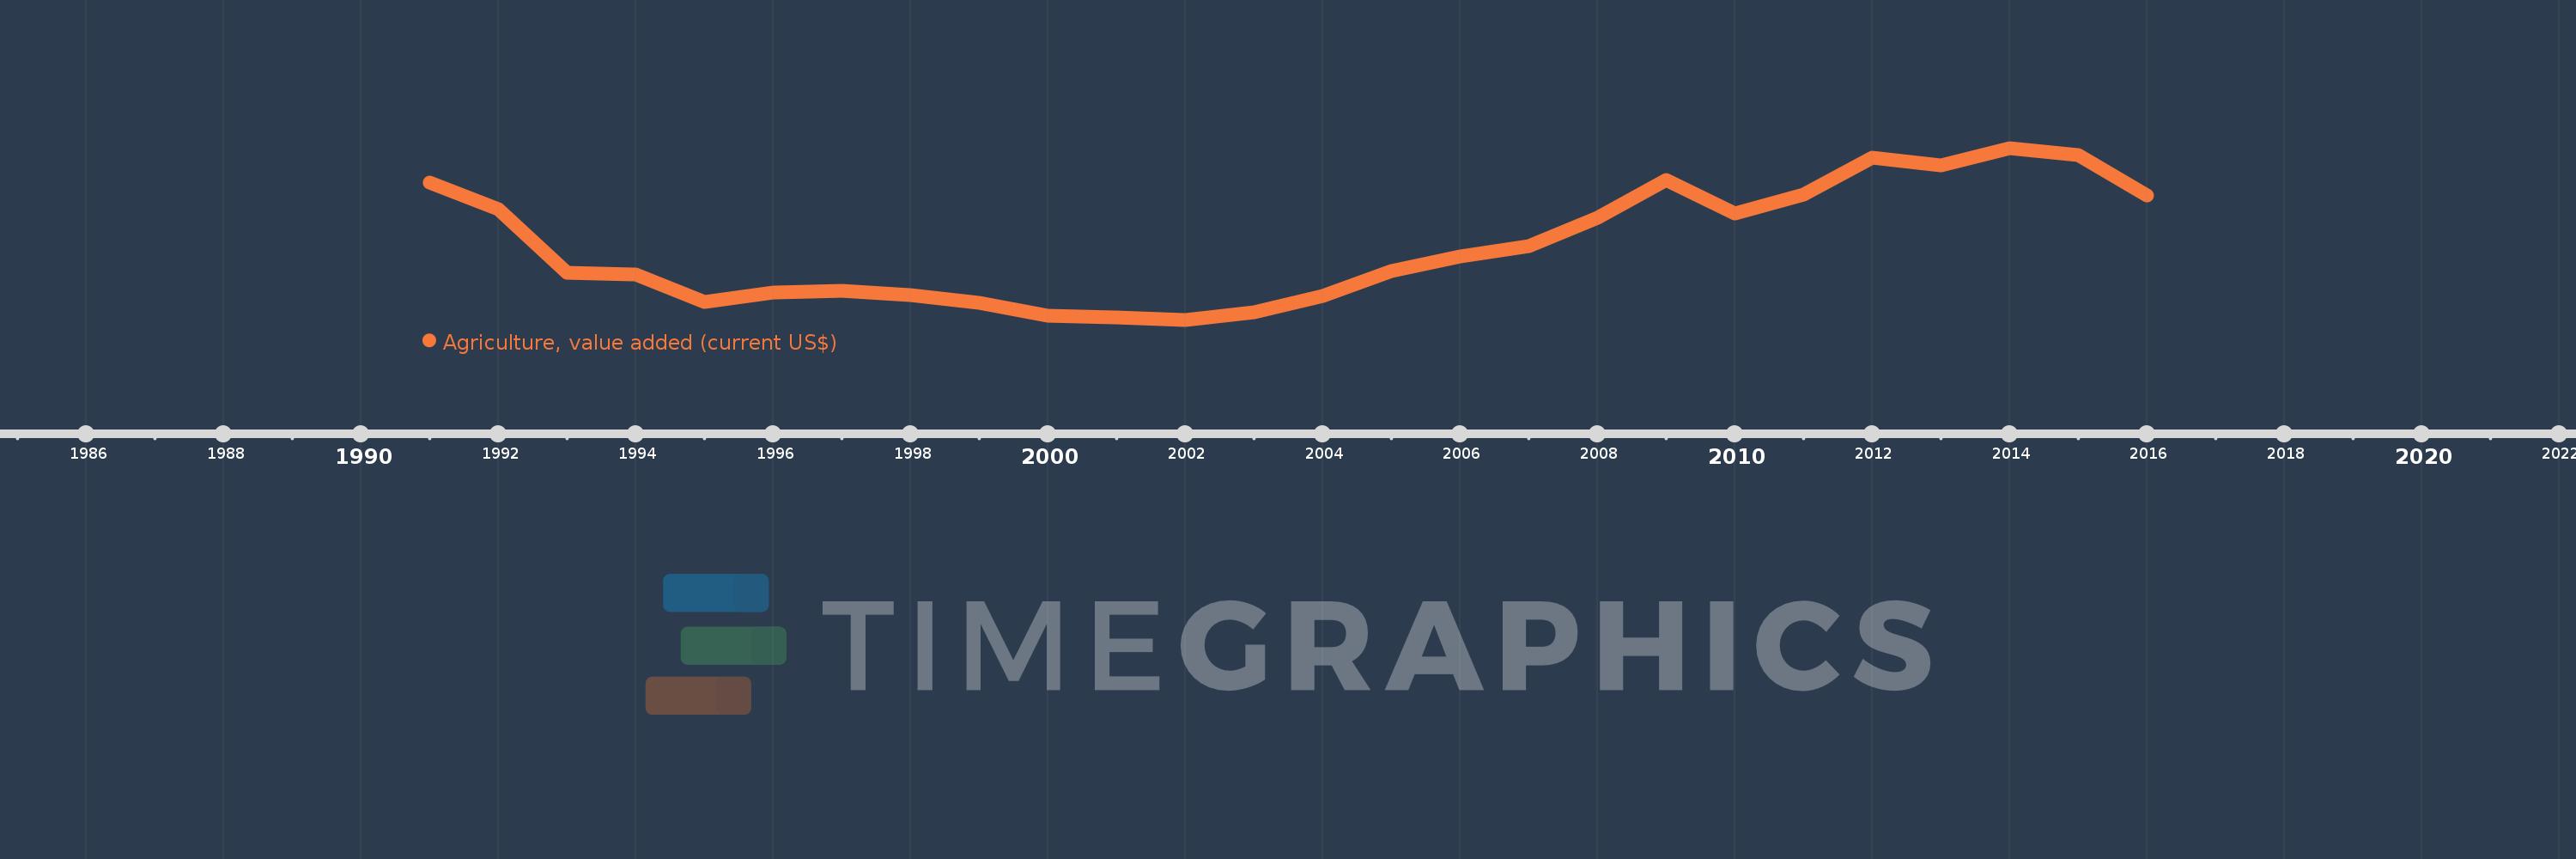
Agriculture, value added (current US$)
2016,2015,2014,2013,2012,2011,2010,2009,2008,2007,2006,2005,2004,2003,2002,2001,2000,1999,1998,1997,1996,1995,1994,1993,1992,1991
This statistics in other country:
AfghanistanAlbaniaAlgeriaAndorraAngolaAntigua and BarbudaArab WorldArgentinaArmeniaArubaAustraliaAustriaAzerbaijanBahamas, TheBahrainBangladeshBarbadosBelarusBelgiumBelizeBeninBermudaBhutanBoliviaBosnia and HerzegovinaBotswanaBrazilBrunei DarussalamBulgariaBurkina FasoBurundiCabo VerdeCambodiaCameroonCanadaCaribbean small statesCayman IslandsCentral African RepublicCentral Europe and the BalticsChadChileChinaColombiaComorosCongo, Dem. Rep.Congo, Rep.Costa RicaCote d'IvoireCroatiaCubaCyprusCzech RepublicDenmarkDjiboutiDominicaDominican RepublicEarly-demographic dividendEast Asia & PacificEast Asia & Pacific (excluding high income)East Asia & Pacific (IDA & IBRD countries)EcuadorEgypt, Arab Rep.El SalvadorEquatorial GuineaEritreaEstoniaEthiopiaEuro areaEurope & Central AsiaEurope & Central Asia (excluding high income)Europe & Central Asia (IDA & IBRD countries)European UnionFijiFinlandFragile and conflict affected situationsFranceFrench PolynesiaGabonGambia, TheGeorgiaGermanyGhanaGreeceGrenadaGuatemalaGuineaGuinea-BissauGuyanaHeavily indebted poor countries (HIPC)High incomeHondurasHong Kong SAR, ChinaHungaryIBRD onlyIcelandIDA & IBRD totalIDA blendIDA onlyIDA totalIndiaIndonesiaIran, Islamic Rep.IraqIrelandItalyJamaicaJapanJordanKazakhstanKenyaKiribatiKorea, Rep.KosovoKuwaitKyrgyz RepublicLao PDRLate-demographic dividendLatin America & Caribbean Latin America & Caribbean (excluding high income)Latin America & the Caribbean (IDA & IBRD countries)LatviaLeast developed countries: UN classificationLebanonLesothoLiberiaLibyaLithuaniaLow & middle incomeLow incomeLower middle incomeLuxembourgMacao SAR, ChinaMacedonia, FYRMadagascarMalawiMalaysiaMaldivesMaliMaltaMarshall IslandsMauritaniaMauritiusMexicoMicronesia, Fed. Sts.Middle East & North AfricaMiddle East & North Africa (excluding high income)Middle East & North Africa (IDA & IBRD countries)Middle incomeMoldovaMongoliaMontenegroMoroccoMozambiqueMyanmarNamibiaNepalNetherlandsNew CaledoniaNew ZealandNicaraguaNigerNigeriaNorth AmericaNorwayOECD membersOmanOther small statesPakistanPalauPanamaPapua New GuineaParaguayPeruPhilippinesPolandPortugalPost-demographic dividendPre-demographic dividendPuerto RicoQatarRomaniaRussian FederationRwandaSamoaSao Tome and PrincipeSaudi ArabiaSenegalSerbiaSeychellesSierra LeoneSingaporeSlovak RepublicSloveniaSmall statesSolomon IslandsSouth AfricaSouth AsiaSouth Asia (IDA & IBRD)SpainSri LankaSt. Kitts and NevisSt. LuciaSt. Vincent and the GrenadinesSub-Saharan Africa Sub-Saharan Africa (excluding high income)Sub-Saharan Africa (IDA & IBRD countries)SudanSurinameSwazilandSwedenSwitzerlandSyrian Arab RepublicTajikistanTanzaniaThailandTimor-LesteTogoTongaTrinidad and TobagoTunisiaTurkeyTurkmenistanTuvaluUgandaUkraineUnited Arab EmiratesUnited KingdomUnited StatesUpper middle incomeUruguayUzbekistanVanuatuVenezuela, RBVietnamWest Bank and GazaWorldYemen, Rep.ZambiaZimbabwe Timeline:
This timeline shows a graph from 1991 to 2016 of Europe & Central Asia (IDA & IBRD countries). No data until 1990. Number of actual observations by date: 26.
Source name:
World Development Indicators
Source organization:
World Bank national accounts data, and OECD National Accounts data files.
Categories, topics:
Agriculture & Rural Development, Economy & Growth
Last updated:
apr 23, 2017
Indicators value changes by year
Minimum:
69.973 bln
jan 1, 2002
Maximum:
231.384 bln
jan 1, 2014
At the date of observation
Value
Absolute change
Change from previous value
jan 1, 1991
198.638 bln
+198.638 bln
0.0%
jan 1, 1992
173.501 bln
-25.138 bln
-12.66%
jan 1, 1993
113.947 bln
-59.553 bln
-34.32%
jan 1, 1994
112.844 bln
-1.104 bln
-0.97%
jan 1, 1995
86.969 bln
-25.875 bln
-22.93%
jan 1, 1996
95.669 bln
+8.7 bln
10.0%
jan 1, 1997
97.095 bln
+1.426 bln
1.49%
jan 1, 1998
93.369 bln
-3.726 bln
-3.84%
jan 1, 1999
85.721 bln
-7.648 bln
-8.19%
jan 1, 2000
73.496 bln
-12.225 bln
-14.26%
jan 1, 2001
72.366 bln
-1.13 bln
-1.54%
jan 1, 2002
69.973 bln
-2.393 bln
-3.31%
jan 1, 2003
77.204 bln
+7.231 bln
10.33%
jan 1, 2004
92.092 bln
+14.888 bln
19.28%
jan 1, 2005
115.373 bln
+23.281 bln
25.28%
jan 1, 2006
129.274 bln
+13.901 bln
12.05%
jan 1, 2007
139.296 bln
+10.022 bln
7.75%
jan 1, 2008
165.873 bln
+26.577 bln
19.08%
jan 1, 2009
200.935 bln
+35.062 bln
21.14%
jan 1, 2010
169.905 bln
-31.03 bln
-15.44%
jan 1, 2011
187.271 bln
+17.366 bln
10.22%
jan 1, 2012
222.077 bln
+34.806 bln
18.59%
jan 1, 2013
215.316 bln
-6.761 bln
-3.04%
jan 1, 2014
231.384 bln
+16.068 bln
7.46%
jan 1, 2015
224.772 bln
-6.612 bln
-2.86%
jan 1, 2016
186.618 bln
-38.154 bln
-16.97%
Ranking of countries by current statistics by years


Comments: