29
/
en
AIzaSyAYiBZKx7MnpbEhh9jyipgxe19OcubqV5w
April 1, 2024
250486
St. Lucia
LCA
true
2
1
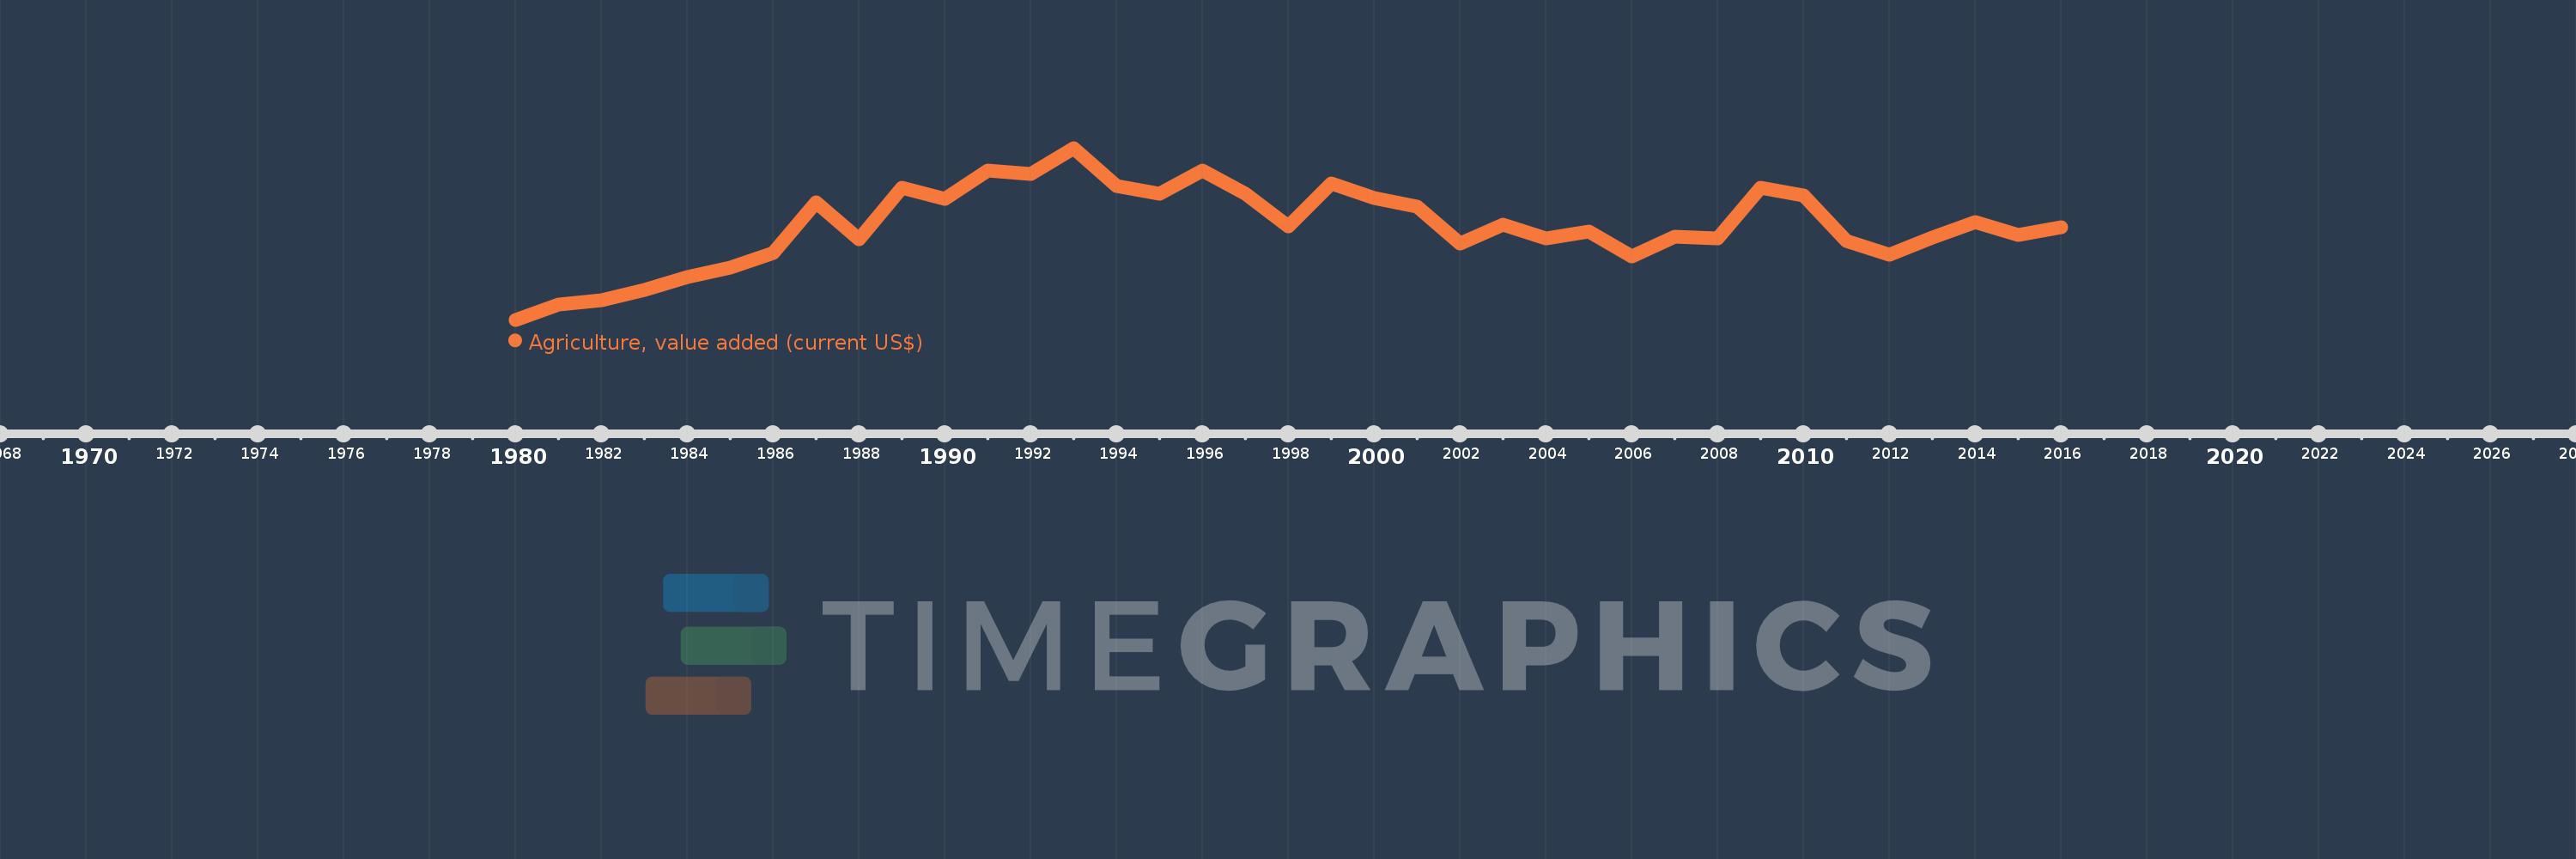
Agriculture, value added (current US$)
2016,2015,2014,2013,2012,2011,2010,2009,2008,2007,2006,2005,2004,2003,2002,2001,2000,1999,1998,1997,1996,1995,1994,1993,1992,1991,1990,1989,1988,1987,1986,1985,1984,1983,1982,1981,1980
This statistics in other country:
AfghanistanAlbaniaAlgeriaAndorraAngolaAntigua and BarbudaArab WorldArgentinaArmeniaArubaAustraliaAustriaAzerbaijanBahamas, TheBahrainBangladeshBarbadosBelarusBelgiumBelizeBeninBermudaBhutanBoliviaBosnia and HerzegovinaBotswanaBrazilBrunei DarussalamBulgariaBurkina FasoBurundiCabo VerdeCambodiaCameroonCanadaCaribbean small statesCayman IslandsCentral African RepublicCentral Europe and the BalticsChadChileChinaColombiaComorosCongo, Dem. Rep.Congo, Rep.Costa RicaCote d'IvoireCroatiaCubaCyprusCzech RepublicDenmarkDjiboutiDominicaDominican RepublicEarly-demographic dividendEast Asia & PacificEast Asia & Pacific (excluding high income)East Asia & Pacific (IDA & IBRD countries)EcuadorEgypt, Arab Rep.El SalvadorEquatorial GuineaEritreaEstoniaEthiopiaEuro areaEurope & Central AsiaEurope & Central Asia (excluding high income)Europe & Central Asia (IDA & IBRD countries)European UnionFijiFinlandFragile and conflict affected situationsFranceFrench PolynesiaGabonGambia, TheGeorgiaGermanyGhanaGreeceGrenadaGuatemalaGuineaGuinea-BissauGuyanaHeavily indebted poor countries (HIPC)High incomeHondurasHong Kong SAR, ChinaHungaryIBRD onlyIcelandIDA & IBRD totalIDA blendIDA onlyIDA totalIndiaIndonesiaIran, Islamic Rep.IraqIrelandItalyJamaicaJapanJordanKazakhstanKenyaKiribatiKorea, Rep.KosovoKuwaitKyrgyz RepublicLao PDRLate-demographic dividendLatin America & Caribbean Latin America & Caribbean (excluding high income)Latin America & the Caribbean (IDA & IBRD countries)LatviaLeast developed countries: UN classificationLebanonLesothoLiberiaLibyaLithuaniaLow & middle incomeLow incomeLower middle incomeLuxembourgMacao SAR, ChinaMacedonia, FYRMadagascarMalawiMalaysiaMaldivesMaliMaltaMarshall IslandsMauritaniaMauritiusMexicoMicronesia, Fed. Sts.Middle East & North AfricaMiddle East & North Africa (excluding high income)Middle East & North Africa (IDA & IBRD countries)Middle incomeMoldovaMongoliaMontenegroMoroccoMozambiqueMyanmarNamibiaNepalNetherlandsNew CaledoniaNew ZealandNicaraguaNigerNigeriaNorth AmericaNorwayOECD membersOmanOther small statesPakistanPalauPanamaPapua New GuineaParaguayPeruPhilippinesPolandPortugalPost-demographic dividendPre-demographic dividendPuerto RicoQatarRomaniaRussian FederationRwandaSamoaSao Tome and PrincipeSaudi ArabiaSenegalSerbiaSeychellesSierra LeoneSingaporeSlovak RepublicSloveniaSmall statesSolomon IslandsSouth AfricaSouth AsiaSouth Asia (IDA & IBRD)SpainSri LankaSt. Kitts and NevisSt. LuciaSt. Vincent and the GrenadinesSub-Saharan Africa Sub-Saharan Africa (excluding high income)Sub-Saharan Africa (IDA & IBRD countries)SudanSurinameSwazilandSwedenSwitzerlandSyrian Arab RepublicTajikistanTanzaniaThailandTimor-LesteTogoTongaTrinidad and TobagoTunisiaTurkeyTurkmenistanTuvaluUgandaUkraineUnited Arab EmiratesUnited KingdomUnited StatesUpper middle incomeUruguayUzbekistanVanuatuVenezuela, RBVietnamWest Bank and GazaWorldYemen, Rep.ZambiaZimbabwe Timeline:
This timeline shows a graph from 1980 to 2016 of St. Lucia. No data until 1979. Number of actual observations by date: 37.
Source name:
World Development Indicators
Source organization:
World Bank national accounts data, and OECD National Accounts data files.
Categories, topics:
Agriculture & Rural Development, Economy & Growth
Last updated:
apr 23, 2017
Indicators value changes by year
Minimum:
12.889 mln
jan 1, 1980
Maximum:
53.741 mln
jan 1, 1993
At the date of observation
Value
Absolute change
Change from previous value
jan 1, 1980
12.889 mln
+12.889 mln
0.0%
jan 1, 1981
16.559 mln
+3.67 mln
28.48%
jan 1, 1982
17.47 mln
+911.111K
5.5%
jan 1, 1983
20.0 mln
+2.53 mln
14.48%
jan 1, 1984
23.13 mln
+3.13 mln
15.65%
jan 1, 1985
25.267 mln
+2.137 mln
9.24%
jan 1, 1986
28.796 mln
+3.53 mln
13.97%
jan 1, 1987
40.856 mln
+12.059 mln
41.88%
jan 1, 1988
32.115 mln
-8.741 mln
-21.39%
jan 1, 1989
44.333 mln
+12.219 mln
38.05%
jan 1, 1990
41.578 mln
-2.756 mln
-6.22%
jan 1, 1991
48.363 mln
+6.785 mln
16.32%
jan 1, 1992
47.556 mln
-807.407K
-1.67%
jan 1, 1993
53.741 mln
+6.185 mln
13.01%
jan 1, 1994
44.704 mln
-9.037 mln
-16.82%
jan 1, 1995
42.752 mln
-1.952 mln
-4.37%
jan 1, 1996
48.444 mln
+5.693 mln
13.32%
jan 1, 1997
42.852 mln
-5.593 mln
-11.54%
jan 1, 1998
35.122 mln
-7.73 mln
-18.04%
jan 1, 1999
45.27 mln
+10.148 mln
28.89%
jan 1, 2000
41.922 mln
-3.348 mln
-7.4%
jan 1, 2001
39.777 mln
-2.145 mln
-5.12%
jan 1, 2002
30.944 mln
-8.833 mln
-22.21%
jan 1, 2003
35.498 mln
+4.553 mln
14.71%
jan 1, 2004
32.28 mln
-3.217 mln
-9.06%
jan 1, 2005
33.93 mln
+1.65 mln
5.11%
jan 1, 2006
27.986 mln
-5.944 mln
-17.52%
jan 1, 2007
32.547 mln
+4.561 mln
16.3%
jan 1, 2008
32.294 mln
-252.444K
-0.78%
jan 1, 2009
44.289 mln
+11.995 mln
37.14%
jan 1, 2010
42.46 mln
-1.83 mln
-4.13%
jan 1, 2011
31.59 mln
-10.869 mln
-25.6%
jan 1, 2012
28.374 mln
-3.216 mln
-10.18%
jan 1, 2013
32.428 mln
+4.054 mln
14.29%
jan 1, 2014
36.113 mln
+3.685 mln
11.36%
jan 1, 2015
33.116 mln
-2.997 mln
-8.3%
jan 1, 2016
34.79 mln
+1.674 mln
5.06%
Ranking of countries by current statistics by years


Comments: