29
/
en
AIzaSyAYiBZKx7MnpbEhh9jyipgxe19OcubqV5w
April 1, 2024
201223
Morocco
MAR
true
2
1
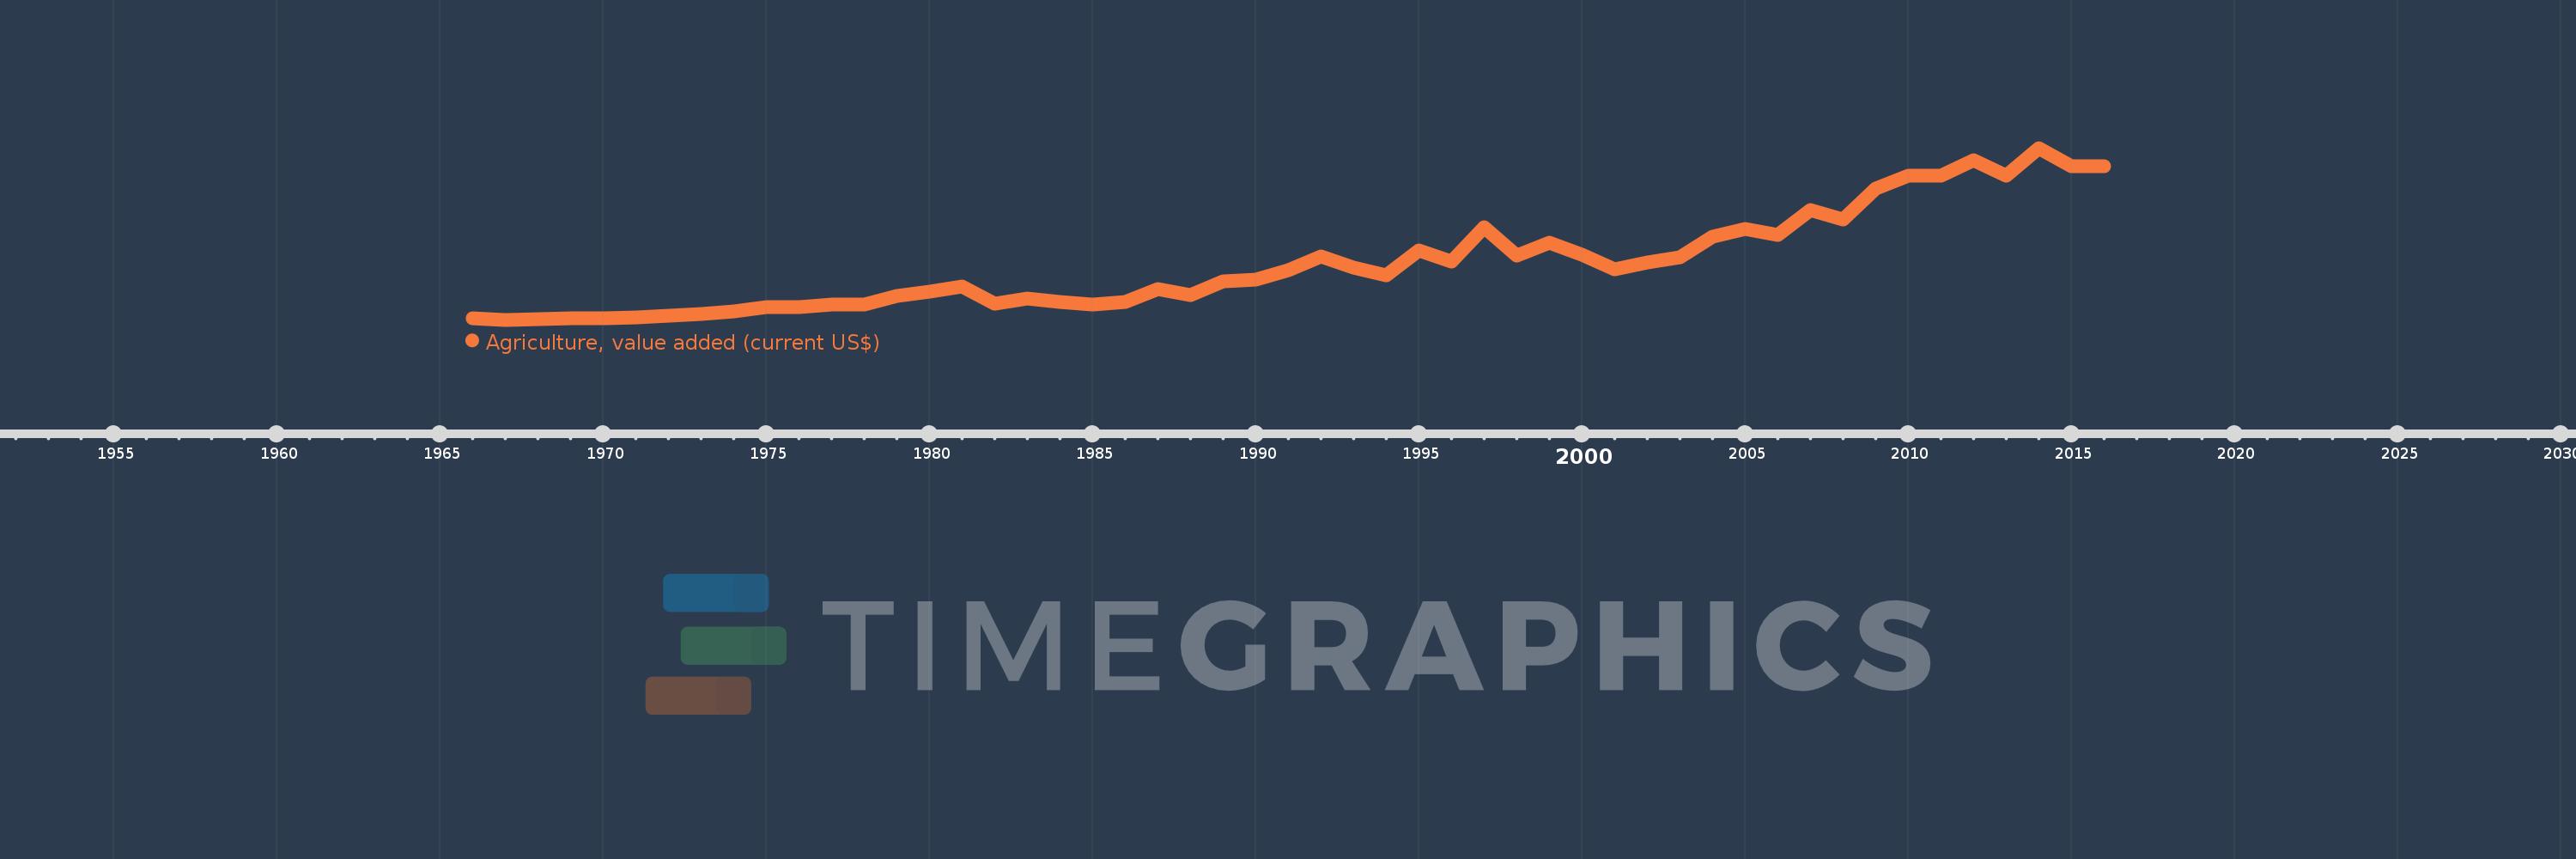
Agriculture, value added (current US$)
2016,2015,2014,2013,2012,2011,2010,2009,2008,2007,2006,2005,2004,2003,2002,2001,2000,1999,1998,1997,1996,1995,1994,1993,1992,1991,1990,1989,1988,1987,1986,1985,1984,1983,1982,1981,1980,1979,1978,1977,1976,1975,1974,1973,1972,1971,1970,1969,1968,1967,1966
This statistics in other country:
AfghanistanAlbaniaAlgeriaAndorraAngolaAntigua and BarbudaArab WorldArgentinaArmeniaArubaAustraliaAustriaAzerbaijanBahamas, TheBahrainBangladeshBarbadosBelarusBelgiumBelizeBeninBermudaBhutanBoliviaBosnia and HerzegovinaBotswanaBrazilBrunei DarussalamBulgariaBurkina FasoBurundiCabo VerdeCambodiaCameroonCanadaCaribbean small statesCayman IslandsCentral African RepublicCentral Europe and the BalticsChadChileChinaColombiaComorosCongo, Dem. Rep.Congo, Rep.Costa RicaCote d'IvoireCroatiaCubaCyprusCzech RepublicDenmarkDjiboutiDominicaDominican RepublicEarly-demographic dividendEast Asia & PacificEast Asia & Pacific (excluding high income)East Asia & Pacific (IDA & IBRD countries)EcuadorEgypt, Arab Rep.El SalvadorEquatorial GuineaEritreaEstoniaEthiopiaEuro areaEurope & Central AsiaEurope & Central Asia (excluding high income)Europe & Central Asia (IDA & IBRD countries)European UnionFijiFinlandFragile and conflict affected situationsFranceFrench PolynesiaGabonGambia, TheGeorgiaGermanyGhanaGreeceGrenadaGuatemalaGuineaGuinea-BissauGuyanaHeavily indebted poor countries (HIPC)High incomeHondurasHong Kong SAR, ChinaHungaryIBRD onlyIcelandIDA & IBRD totalIDA blendIDA onlyIDA totalIndiaIndonesiaIran, Islamic Rep.IraqIrelandItalyJamaicaJapanJordanKazakhstanKenyaKiribatiKorea, Rep.KosovoKuwaitKyrgyz RepublicLao PDRLate-demographic dividendLatin America & Caribbean Latin America & Caribbean (excluding high income)Latin America & the Caribbean (IDA & IBRD countries)LatviaLeast developed countries: UN classificationLebanonLesothoLiberiaLibyaLithuaniaLow & middle incomeLow incomeLower middle incomeLuxembourgMacao SAR, ChinaMacedonia, FYRMadagascarMalawiMalaysiaMaldivesMaliMaltaMarshall IslandsMauritaniaMauritiusMexicoMicronesia, Fed. Sts.Middle East & North AfricaMiddle East & North Africa (excluding high income)Middle East & North Africa (IDA & IBRD countries)Middle incomeMoldovaMongoliaMontenegroMoroccoMozambiqueMyanmarNamibiaNepalNetherlandsNew CaledoniaNew ZealandNicaraguaNigerNigeriaNorth AmericaNorwayOECD membersOmanOther small statesPakistanPalauPanamaPapua New GuineaParaguayPeruPhilippinesPolandPortugalPost-demographic dividendPre-demographic dividendPuerto RicoQatarRomaniaRussian FederationRwandaSamoaSao Tome and PrincipeSaudi ArabiaSenegalSerbiaSeychellesSierra LeoneSingaporeSlovak RepublicSloveniaSmall statesSolomon IslandsSouth AfricaSouth AsiaSouth Asia (IDA & IBRD)SpainSri LankaSt. Kitts and NevisSt. LuciaSt. Vincent and the GrenadinesSub-Saharan Africa Sub-Saharan Africa (excluding high income)Sub-Saharan Africa (IDA & IBRD countries)SudanSurinameSwazilandSwedenSwitzerlandSyrian Arab RepublicTajikistanTanzaniaThailandTimor-LesteTogoTongaTrinidad and TobagoTunisiaTurkeyTurkmenistanTuvaluUgandaUkraineUnited Arab EmiratesUnited KingdomUnited StatesUpper middle incomeUruguayUzbekistanVanuatuVenezuela, RBVietnamWest Bank and GazaWorldYemen, Rep.ZambiaZimbabwe Timeline:
This timeline shows a graph from 1966 to 2016 of Morocco. No data until 1965. Number of actual observations by date: 51.
Source name:
World Development Indicators
Source organization:
World Bank national accounts data, and OECD National Accounts data files.
Categories, topics:
Agriculture & Rural Development, Economy & Growth
Last updated:
apr 23, 2017
Indicators value changes by year
Minimum:
604.091 mln
jan 1, 1967
Maximum:
14.303 bln
jan 1, 2014
At the date of observation
Value
Absolute change
Change from previous value
jan 1, 1966
691.236 mln
+691.236 mln
0.0%
jan 1, 1967
604.091 mln
-87.146 mln
-12.61%
jan 1, 1968
662.188 mln
+58.097 mln
9.62%
jan 1, 1969
733.524 mln
+71.337 mln
10.77%
jan 1, 1970
705.859 mln
-27.665 mln
-3.77%
jan 1, 1971
788.855 mln
+82.996 mln
11.76%
jan 1, 1972
952.673 mln
+163.818 mln
20.77%
jan 1, 1973
1.079 bln
+125.835 mln
13.21%
jan 1, 1974
1.3 bln
+221.499 mln
20.54%
jan 1, 1975
1.585 bln
+285.42 mln
21.96%
jan 1, 1976
1.608 bln
+22.716 mln
1.43%
jan 1, 1977
1.845 bln
+237.172 mln
14.75%
jan 1, 1978
1.81 bln
-34.865 mln
-1.89%
jan 1, 1979
2.504 bln
+693.93 mln
38.33%
jan 1, 1980
2.851 bln
+346.534 mln
13.84%
jan 1, 1981
3.286 bln
+434.942 mln
15.26%
jan 1, 1982
1.901 bln
-1.385 bln
-42.16%
jan 1, 1983
2.285 bln
+384.425 mln
20.23%
jan 1, 1984
2.051 bln
-233.58 mln
-10.22%
jan 1, 1985
1.797 bln
-254.257 mln
-12.39%
jan 1, 1986
1.992 bln
+195.254 mln
10.86%
jan 1, 1987
3.057 bln
+1.064 bln
53.4%
jan 1, 1988
2.561 bln
-495.979 mln
-16.23%
jan 1, 1989
3.651 bln
+1.09 bln
42.59%
jan 1, 1990
3.777 bln
+125.56 mln
3.44%
jan 1, 1991
4.556 bln
+779.149 mln
20.63%
jan 1, 1992
5.65 bln
+1.094 bln
24.01%
jan 1, 1993
4.734 bln
-915.798 mln
-16.21%
jan 1, 1994
4.137 bln
-596.781 mln
-12.61%
jan 1, 1995
6.145 bln
+2.008 bln
48.53%
jan 1, 1996
5.266 bln
-878.878 mln
-14.3%
jan 1, 1997
7.959 bln
+2.693 bln
51.13%
jan 1, 1998
5.729 bln
-2.23 bln
-28.02%
jan 1, 1999
6.736 bln
+1.007 bln
17.58%
jan 1, 2000
5.773 bln
-963.516 mln
-14.3%
jan 1, 2001
4.615 bln
-1.157 bln
-20.05%
jan 1, 2002
5.205 bln
+590.309 mln
12.79%
jan 1, 2003
5.575 bln
+369.99 mln
7.11%
jan 1, 2004
7.249 bln
+1.673 bln
30.01%
jan 1, 2005
7.847 bln
+598.39 mln
8.25%
jan 1, 2006
7.366 bln
-480.854 mln
-6.13%
jan 1, 2007
9.337 bln
+1.97 bln
26.75%
jan 1, 2008
8.586 bln
-750.499 mln
-8.04%
jan 1, 2009
11.063 bln
+2.477 bln
28.84%
jan 1, 2010
12.103 bln
+1.04 bln
9.4%
jan 1, 2011
12.066 bln
-37.706 mln
-0.31%
jan 1, 2012
13.3 bln
+1.234 bln
10.23%
jan 1, 2013
12.116 bln
-1.184 bln
-8.9%
jan 1, 2014
14.303 bln
+2.188 bln
18.06%
jan 1, 2015
12.824 bln
-1.48 bln
-10.34%
jan 1, 2016
12.872 bln
+47.937 mln
0.37%
Ranking of countries by current statistics by years


Comments: