29
/
en
AIzaSyAYiBZKx7MnpbEhh9jyipgxe19OcubqV5w
April 1, 2024
118643
Denmark
DNK
true
2
1
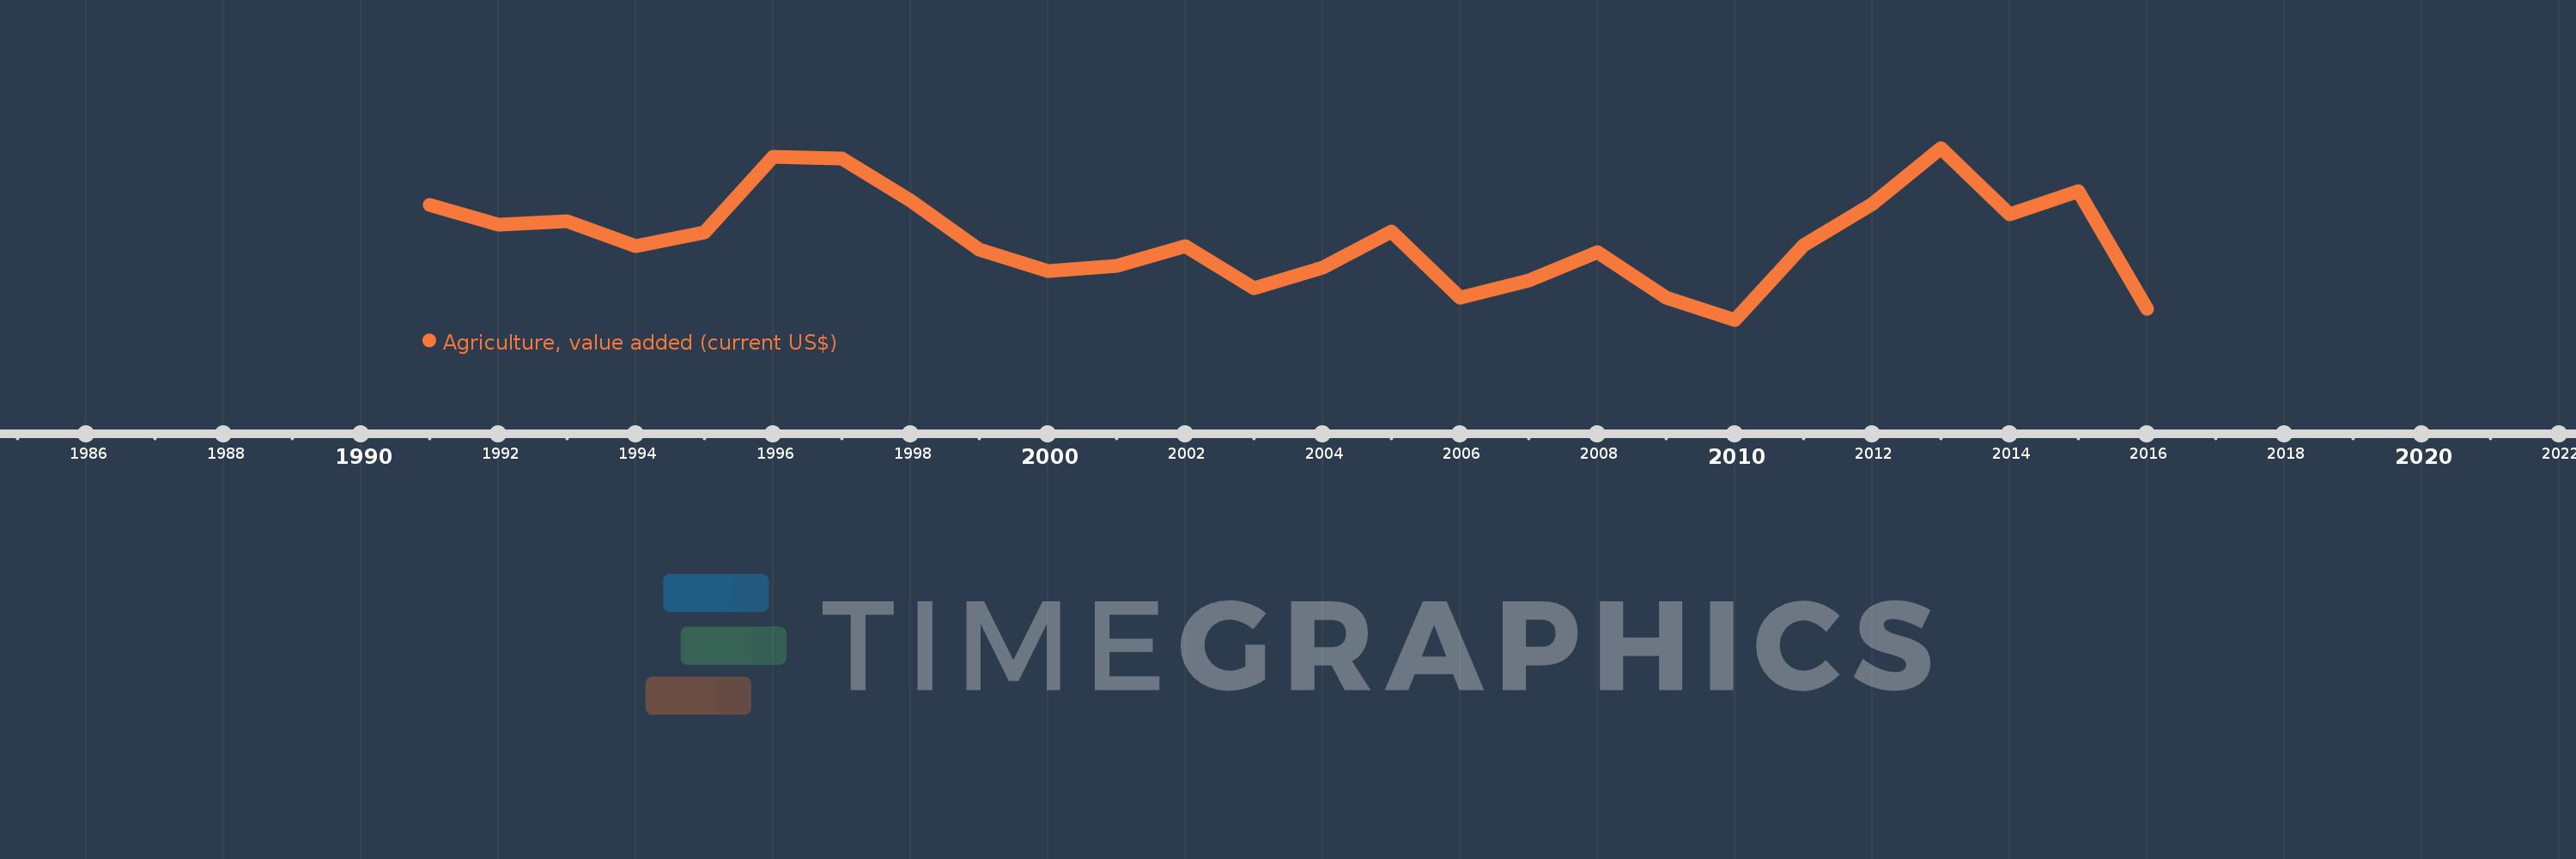
Agriculture, value added (current US$)
2016,2015,2014,2013,2012,2011,2010,2009,2008,2007,2006,2005,2004,2003,2002,2001,2000,1999,1998,1997,1996,1995,1994,1993,1992,1991
This statistics in other country:
AfghanistanAlbaniaAlgeriaAndorraAngolaAntigua and BarbudaArab WorldArgentinaArmeniaArubaAustraliaAustriaAzerbaijanBahamas, TheBahrainBangladeshBarbadosBelarusBelgiumBelizeBeninBermudaBhutanBoliviaBosnia and HerzegovinaBotswanaBrazilBrunei DarussalamBulgariaBurkina FasoBurundiCabo VerdeCambodiaCameroonCanadaCaribbean small statesCayman IslandsCentral African RepublicCentral Europe and the BalticsChadChileChinaColombiaComorosCongo, Dem. Rep.Congo, Rep.Costa RicaCote d'IvoireCroatiaCubaCyprusCzech RepublicDenmarkDjiboutiDominicaDominican RepublicEarly-demographic dividendEast Asia & PacificEast Asia & Pacific (excluding high income)East Asia & Pacific (IDA & IBRD countries)EcuadorEgypt, Arab Rep.El SalvadorEquatorial GuineaEritreaEstoniaEthiopiaEuro areaEurope & Central AsiaEurope & Central Asia (excluding high income)Europe & Central Asia (IDA & IBRD countries)European UnionFijiFinlandFragile and conflict affected situationsFranceFrench PolynesiaGabonGambia, TheGeorgiaGermanyGhanaGreeceGrenadaGuatemalaGuineaGuinea-BissauGuyanaHeavily indebted poor countries (HIPC)High incomeHondurasHong Kong SAR, ChinaHungaryIBRD onlyIcelandIDA & IBRD totalIDA blendIDA onlyIDA totalIndiaIndonesiaIran, Islamic Rep.IraqIrelandItalyJamaicaJapanJordanKazakhstanKenyaKiribatiKorea, Rep.KosovoKuwaitKyrgyz RepublicLao PDRLate-demographic dividendLatin America & Caribbean Latin America & Caribbean (excluding high income)Latin America & the Caribbean (IDA & IBRD countries)LatviaLeast developed countries: UN classificationLebanonLesothoLiberiaLibyaLithuaniaLow & middle incomeLow incomeLower middle incomeLuxembourgMacao SAR, ChinaMacedonia, FYRMadagascarMalawiMalaysiaMaldivesMaliMaltaMarshall IslandsMauritaniaMauritiusMexicoMicronesia, Fed. Sts.Middle East & North AfricaMiddle East & North Africa (excluding high income)Middle East & North Africa (IDA & IBRD countries)Middle incomeMoldovaMongoliaMontenegroMoroccoMozambiqueMyanmarNamibiaNepalNetherlandsNew CaledoniaNew ZealandNicaraguaNigerNigeriaNorth AmericaNorwayOECD membersOmanOther small statesPakistanPalauPanamaPapua New GuineaParaguayPeruPhilippinesPolandPortugalPost-demographic dividendPre-demographic dividendPuerto RicoQatarRomaniaRussian FederationRwandaSamoaSao Tome and PrincipeSaudi ArabiaSenegalSerbiaSeychellesSierra LeoneSingaporeSlovak RepublicSloveniaSmall statesSolomon IslandsSouth AfricaSouth AsiaSouth Asia (IDA & IBRD)SpainSri LankaSt. Kitts and NevisSt. LuciaSt. Vincent and the GrenadinesSub-Saharan Africa Sub-Saharan Africa (excluding high income)Sub-Saharan Africa (IDA & IBRD countries)SudanSurinameSwazilandSwedenSwitzerlandSyrian Arab RepublicTajikistanTanzaniaThailandTimor-LesteTogoTongaTrinidad and TobagoTunisiaTurkeyTurkmenistanTuvaluUgandaUkraineUnited Arab EmiratesUnited KingdomUnited StatesUpper middle incomeUruguayUzbekistanVanuatuVenezuela, RBVietnamWest Bank and GazaWorldYemen, Rep.ZambiaZimbabwe Timeline:
This timeline shows a graph from 1991 to 2016 of Denmark. No data until 1990. Number of actual observations by date: 26.
Source name:
World Development Indicators
Source organization:
World Bank national accounts data, and OECD National Accounts data files.
Categories, topics:
Agriculture & Rural Development, Economy & Growth
Last updated:
apr 23, 2017
Indicators value changes by year
Minimum:
2.678 bln
jan 1, 2010
Maximum:
5.413 bln
jan 1, 2013
At the date of observation
Value
Absolute change
Change from previous value
jan 1, 1991
4.507 bln
+4.507 bln
0.0%
jan 1, 1992
4.196 bln
-311.507 mln
-6.91%
jan 1, 1993
4.251 bln
+55.091 mln
1.31%
jan 1, 1994
3.857 bln
-393.779 mln
-9.26%
jan 1, 1995
4.066 bln
+209.209 mln
5.42%
jan 1, 1996
5.276 bln
+1.21 bln
29.76%
jan 1, 1997
5.24 bln
-36.164 mln
-0.69%
jan 1, 1998
4.576 bln
-663.542 mln
-12.66%
jan 1, 1999
3.796 bln
-780.61 mln
-17.06%
jan 1, 2000
3.454 bln
-341.499 mln
-9.0%
jan 1, 2001
3.532 bln
+78.116 mln
2.26%
jan 1, 2002
3.855 bln
+322.881 mln
9.14%
jan 1, 2003
3.182 bln
-673.558 mln
-17.47%
jan 1, 2004
3.513 bln
+331.307 mln
10.41%
jan 1, 2005
4.079 bln
+565.488 mln
16.1%
jan 1, 2006
3.03 bln
-1.049 bln
-25.71%
jan 1, 2007
3.296 bln
+266.328 mln
8.79%
jan 1, 2008
3.751 bln
+455.082 mln
13.81%
jan 1, 2009
3.031 bln
-720.18 mln
-19.2%
jan 1, 2010
2.678 bln
-353.221 mln
-11.65%
jan 1, 2011
3.87 bln
+1.192 bln
44.52%
jan 1, 2012
4.514 bln
+643.625 mln
16.63%
jan 1, 2013
5.413 bln
+899.647 mln
19.93%
jan 1, 2014
4.355 bln
-1.058 bln
-19.55%
jan 1, 2015
4.727 bln
+371.271 mln
8.52%
jan 1, 2016
2.858 bln
-1.869 bln
-39.53%
Ranking of countries by current statistics by years


Comments: