29
/
en
AIzaSyAYiBZKx7MnpbEhh9jyipgxe19OcubqV5w
April 1, 2024
165790
Kazakhstan
KAZ
true
2
1
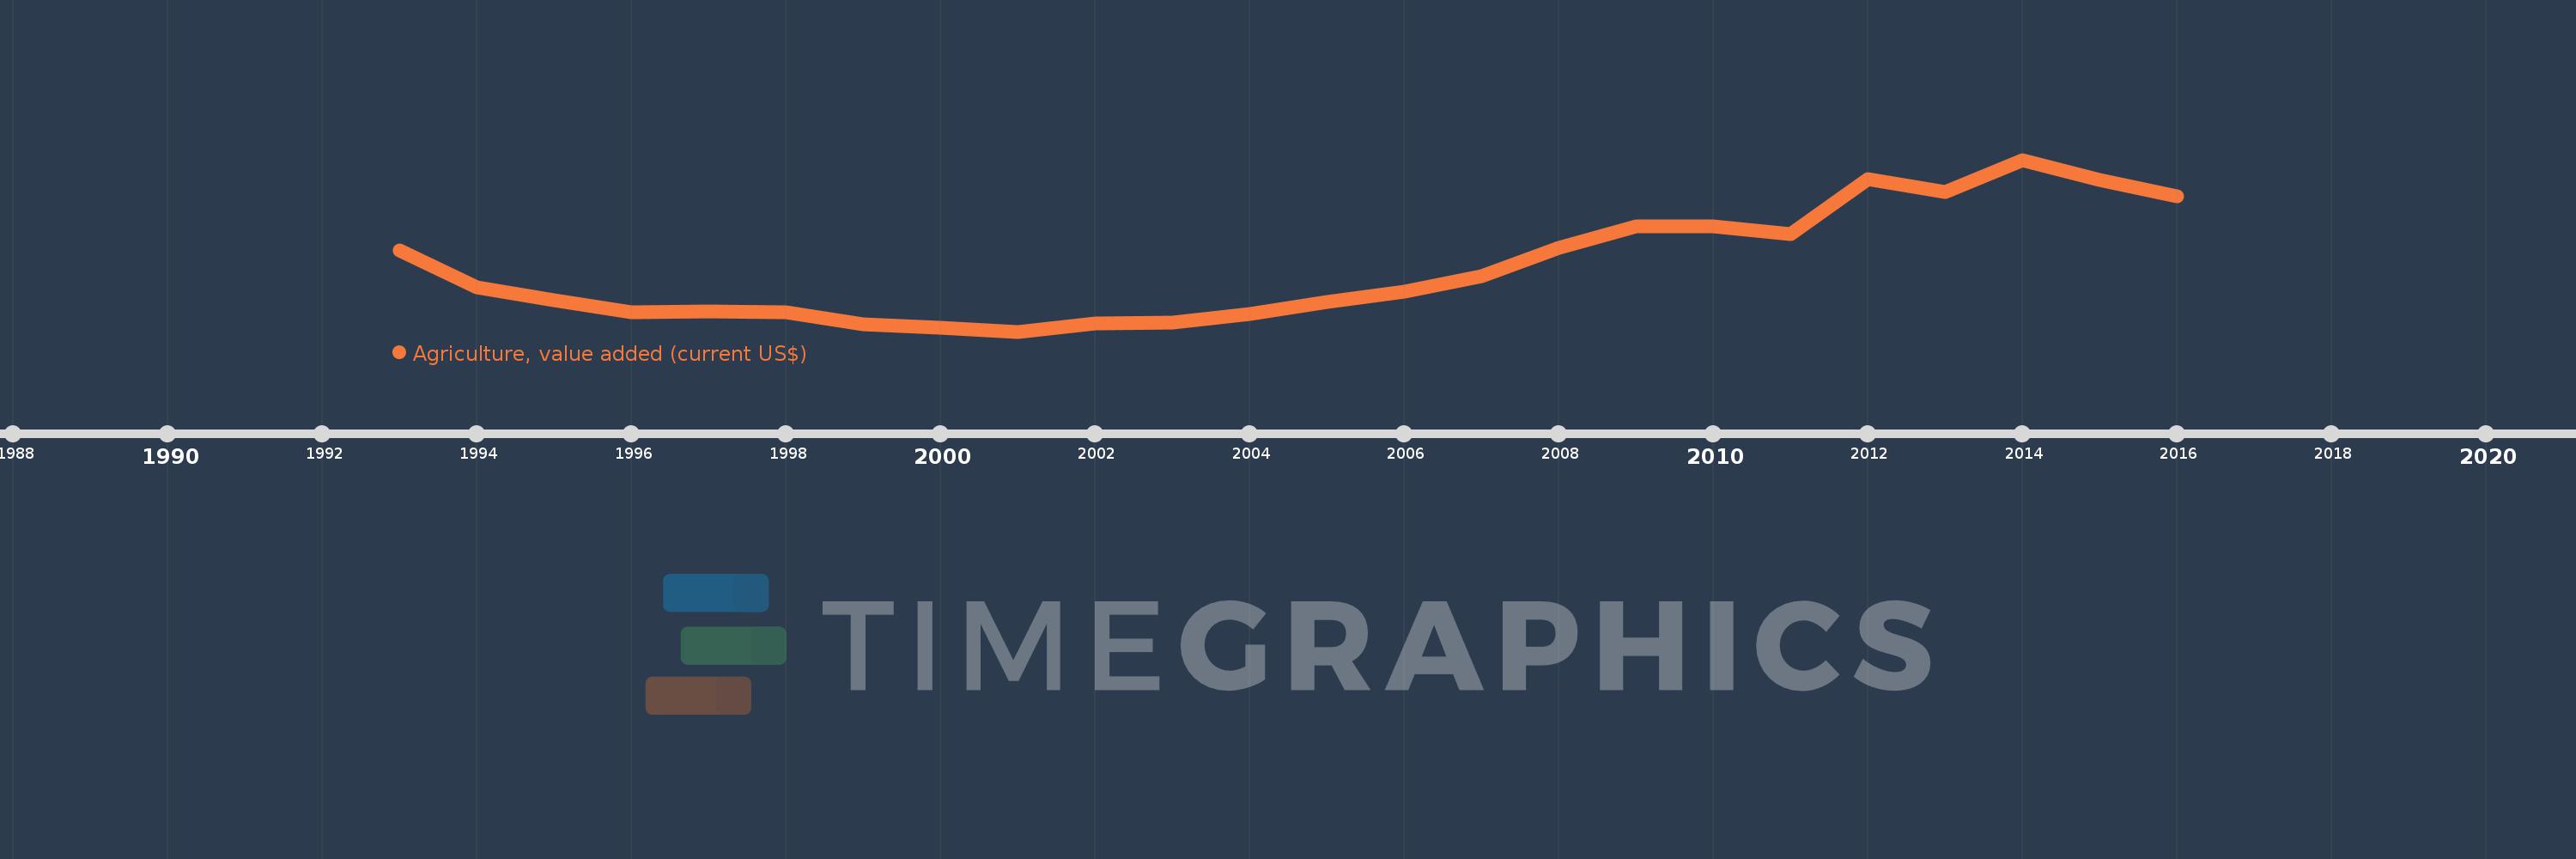
Agriculture, value added (current US$)
2016,2015,2014,2013,2012,2011,2010,2009,2008,2007,2006,2005,2004,2003,2002,2001,2000,1999,1998,1997,1996,1995,1994,1993
This statistics in other country:
AfghanistanAlbaniaAlgeriaAndorraAngolaAntigua and BarbudaArab WorldArgentinaArmeniaArubaAustraliaAustriaAzerbaijanBahamas, TheBahrainBangladeshBarbadosBelarusBelgiumBelizeBeninBermudaBhutanBoliviaBosnia and HerzegovinaBotswanaBrazilBrunei DarussalamBulgariaBurkina FasoBurundiCabo VerdeCambodiaCameroonCanadaCaribbean small statesCayman IslandsCentral African RepublicCentral Europe and the BalticsChadChileChinaColombiaComorosCongo, Dem. Rep.Congo, Rep.Costa RicaCote d'IvoireCroatiaCubaCyprusCzech RepublicDenmarkDjiboutiDominicaDominican RepublicEarly-demographic dividendEast Asia & PacificEast Asia & Pacific (excluding high income)East Asia & Pacific (IDA & IBRD countries)EcuadorEgypt, Arab Rep.El SalvadorEquatorial GuineaEritreaEstoniaEthiopiaEuro areaEurope & Central AsiaEurope & Central Asia (excluding high income)Europe & Central Asia (IDA & IBRD countries)European UnionFijiFinlandFragile and conflict affected situationsFranceFrench PolynesiaGabonGambia, TheGeorgiaGermanyGhanaGreeceGrenadaGuatemalaGuineaGuinea-BissauGuyanaHeavily indebted poor countries (HIPC)High incomeHondurasHong Kong SAR, ChinaHungaryIBRD onlyIcelandIDA & IBRD totalIDA blendIDA onlyIDA totalIndiaIndonesiaIran, Islamic Rep.IraqIrelandItalyJamaicaJapanJordanKazakhstanKenyaKiribatiKorea, Rep.KosovoKuwaitKyrgyz RepublicLao PDRLate-demographic dividendLatin America & Caribbean Latin America & Caribbean (excluding high income)Latin America & the Caribbean (IDA & IBRD countries)LatviaLeast developed countries: UN classificationLebanonLesothoLiberiaLibyaLithuaniaLow & middle incomeLow incomeLower middle incomeLuxembourgMacao SAR, ChinaMacedonia, FYRMadagascarMalawiMalaysiaMaldivesMaliMaltaMarshall IslandsMauritaniaMauritiusMexicoMicronesia, Fed. Sts.Middle East & North AfricaMiddle East & North Africa (excluding high income)Middle East & North Africa (IDA & IBRD countries)Middle incomeMoldovaMongoliaMontenegroMoroccoMozambiqueMyanmarNamibiaNepalNetherlandsNew CaledoniaNew ZealandNicaraguaNigerNigeriaNorth AmericaNorwayOECD membersOmanOther small statesPakistanPalauPanamaPapua New GuineaParaguayPeruPhilippinesPolandPortugalPost-demographic dividendPre-demographic dividendPuerto RicoQatarRomaniaRussian FederationRwandaSamoaSao Tome and PrincipeSaudi ArabiaSenegalSerbiaSeychellesSierra LeoneSingaporeSlovak RepublicSloveniaSmall statesSolomon IslandsSouth AfricaSouth AsiaSouth Asia (IDA & IBRD)SpainSri LankaSt. Kitts and NevisSt. LuciaSt. Vincent and the GrenadinesSub-Saharan Africa Sub-Saharan Africa (excluding high income)Sub-Saharan Africa (IDA & IBRD countries)SudanSurinameSwazilandSwedenSwitzerlandSyrian Arab RepublicTajikistanTanzaniaThailandTimor-LesteTogoTongaTrinidad and TobagoTunisiaTurkeyTurkmenistanTuvaluUgandaUkraineUnited Arab EmiratesUnited KingdomUnited StatesUpper middle incomeUruguayUzbekistanVanuatuVenezuela, RBVietnamWest Bank and GazaWorldYemen, Rep.ZambiaZimbabwe Timeline:
This timeline shows a graph from 1993 to 2016 of Kazakhstan. No data until 1992. Number of actual observations by date: 24.
Source name:
World Development Indicators
Source organization:
World Bank national accounts data, and OECD National Accounts data files.
Categories, topics:
Agriculture & Rural Development, Economy & Growth
Last updated:
apr 23, 2017
Indicators value changes by year
Minimum:
1.484 bln
jan 1, 2001
Maximum:
10.657 bln
jan 1, 2014
At the date of observation
Value
Absolute change
Change from previous value
jan 1, 1993
5.814 bln
+5.814 bln
0.0%
jan 1, 1994
3.848 bln
-1.966 bln
-33.81%
jan 1, 1995
3.176 bln
-671.601 mln
-17.45%
jan 1, 1996
2.512 bln
-664.452 mln
-20.92%
jan 1, 1997
2.556 bln
+44.222 mln
1.76%
jan 1, 1998
2.528 bln
-27.83 mln
-1.09%
jan 1, 1999
1.896 bln
-632.359 mln
-25.01%
jan 1, 2000
1.668 bln
-228.152 mln
-12.03%
jan 1, 2001
1.484 bln
-184.284 mln
-11.05%
jan 1, 2002
1.933 bln
+449.161 mln
30.27%
jan 1, 2003
1.97 bln
+37.135 mln
1.92%
jan 1, 2004
2.424 bln
+454.288 mln
23.06%
jan 1, 2005
3.074 bln
+649.465 mln
26.79%
jan 1, 2006
3.639 bln
+564.832 mln
18.38%
jan 1, 2007
4.452 bln
+813.334 mln
22.35%
jan 1, 2008
5.935 bln
+1.483 bln
33.31%
jan 1, 2009
7.093 bln
+1.159 bln
19.52%
jan 1, 2010
7.088 bln
-5.603 mln
-0.08%
jan 1, 2011
6.678 bln
-410.174 mln
-5.79%
jan 1, 2012
9.61 bln
+2.932 bln
43.91%
jan 1, 2013
8.92 bln
-690.421 mln
-7.18%
jan 1, 2014
10.657 bln
+1.737 bln
19.48%
jan 1, 2015
9.586 bln
-1.071 bln
-10.05%
jan 1, 2016
8.686 bln
-900.599 mln
-9.39%
Ranking of countries by current statistics by years


Comments: