29
/
en
AIzaSyAYiBZKx7MnpbEhh9jyipgxe19OcubqV5w
April 1, 2024
38736
IDA only
IDX
false
2
1
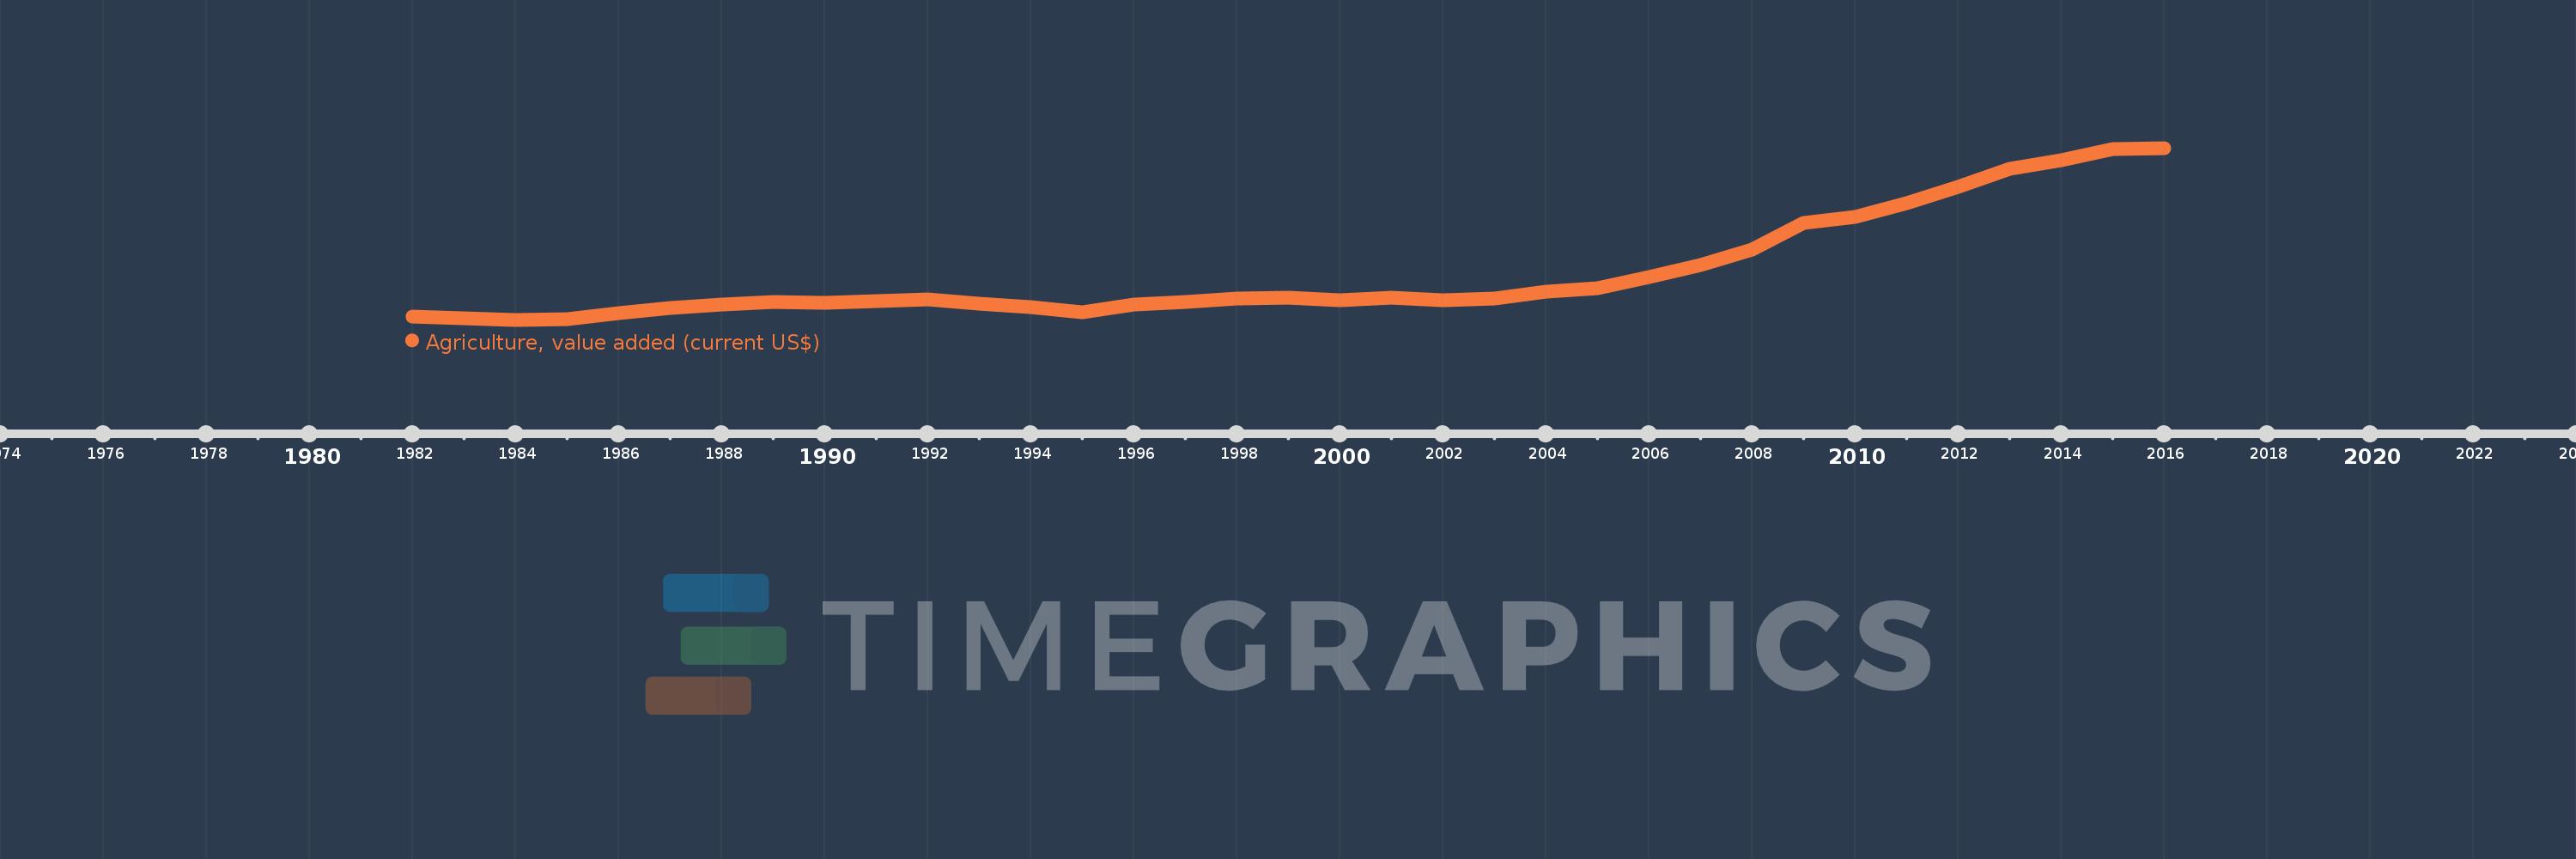
Agriculture, value added (current US$)
2016,2015,2014,2013,2012,2011,2010,2009,2008,2007,2006,2005,2004,2003,2002,2001,2000,1999,1998,1997,1996,1995,1994,1993,1992,1991,1990,1989,1988,1987,1986,1985,1984,1983,1982
This statistics in other country:
AfghanistanAlbaniaAlgeriaAndorraAngolaAntigua and BarbudaArab WorldArgentinaArmeniaArubaAustraliaAustriaAzerbaijanBahamas, TheBahrainBangladeshBarbadosBelarusBelgiumBelizeBeninBermudaBhutanBoliviaBosnia and HerzegovinaBotswanaBrazilBrunei DarussalamBulgariaBurkina FasoBurundiCabo VerdeCambodiaCameroonCanadaCaribbean small statesCayman IslandsCentral African RepublicCentral Europe and the BalticsChadChileChinaColombiaComorosCongo, Dem. Rep.Congo, Rep.Costa RicaCote d'IvoireCroatiaCubaCyprusCzech RepublicDenmarkDjiboutiDominicaDominican RepublicEarly-demographic dividendEast Asia & PacificEast Asia & Pacific (excluding high income)East Asia & Pacific (IDA & IBRD countries)EcuadorEgypt, Arab Rep.El SalvadorEquatorial GuineaEritreaEstoniaEthiopiaEuro areaEurope & Central AsiaEurope & Central Asia (excluding high income)Europe & Central Asia (IDA & IBRD countries)European UnionFijiFinlandFragile and conflict affected situationsFranceFrench PolynesiaGabonGambia, TheGeorgiaGermanyGhanaGreeceGrenadaGuatemalaGuineaGuinea-BissauGuyanaHeavily indebted poor countries (HIPC)High incomeHondurasHong Kong SAR, ChinaHungaryIBRD onlyIcelandIDA & IBRD totalIDA blendIDA onlyIDA totalIndiaIndonesiaIran, Islamic Rep.IraqIrelandItalyJamaicaJapanJordanKazakhstanKenyaKiribatiKorea, Rep.KosovoKuwaitKyrgyz RepublicLao PDRLate-demographic dividendLatin America & Caribbean Latin America & Caribbean (excluding high income)Latin America & the Caribbean (IDA & IBRD countries)LatviaLeast developed countries: UN classificationLebanonLesothoLiberiaLibyaLithuaniaLow & middle incomeLow incomeLower middle incomeLuxembourgMacao SAR, ChinaMacedonia, FYRMadagascarMalawiMalaysiaMaldivesMaliMaltaMarshall IslandsMauritaniaMauritiusMexicoMicronesia, Fed. Sts.Middle East & North AfricaMiddle East & North Africa (excluding high income)Middle East & North Africa (IDA & IBRD countries)Middle incomeMoldovaMongoliaMontenegroMoroccoMozambiqueMyanmarNamibiaNepalNetherlandsNew CaledoniaNew ZealandNicaraguaNigerNigeriaNorth AmericaNorwayOECD membersOmanOther small statesPakistanPalauPanamaPapua New GuineaParaguayPeruPhilippinesPolandPortugalPost-demographic dividendPre-demographic dividendPuerto RicoQatarRomaniaRussian FederationRwandaSamoaSao Tome and PrincipeSaudi ArabiaSenegalSerbiaSeychellesSierra LeoneSingaporeSlovak RepublicSloveniaSmall statesSolomon IslandsSouth AfricaSouth AsiaSouth Asia (IDA & IBRD)SpainSri LankaSt. Kitts and NevisSt. LuciaSt. Vincent and the GrenadinesSub-Saharan Africa Sub-Saharan Africa (excluding high income)Sub-Saharan Africa (IDA & IBRD countries)SudanSurinameSwazilandSwedenSwitzerlandSyrian Arab RepublicTajikistanTanzaniaThailandTimor-LesteTogoTongaTrinidad and TobagoTunisiaTurkeyTurkmenistanTuvaluUgandaUkraineUnited Arab EmiratesUnited KingdomUnited StatesUpper middle incomeUruguayUzbekistanVanuatuVenezuela, RBVietnamWest Bank and GazaWorldYemen, Rep.ZambiaZimbabwe Timeline:
This timeline shows a graph from 1982 to 2016 of IDA only. No data until 1981. Number of actual observations by date: 35.
Source name:
World Development Indicators
Source organization:
World Bank national accounts data, and OECD National Accounts data files.
Categories, topics:
Agriculture & Rural Development, Economy & Growth
Last updated:
apr 23, 2017
Indicators value changes by year
Minimum:
47.561 bln
jan 1, 1984
Maximum:
253.889 bln
jan 1, 2016
At the date of observation
Value
Absolute change
Change from previous value
jan 1, 1982
50.898 bln
+50.898 bln
0.0%
jan 1, 1983
49.239 bln
-1.66 bln
-3.26%
jan 1, 1984
47.561 bln
-1.678 bln
-3.41%
jan 1, 1985
48.396 bln
+834.932 mln
1.76%
jan 1, 1986
55.341 bln
+6.946 bln
14.35%
jan 1, 1987
61.445 bln
+6.104 bln
11.03%
jan 1, 1988
65.932 bln
+4.487 bln
7.3%
jan 1, 1989
68.896 bln
+2.964 bln
4.5%
jan 1, 1990
67.377 bln
-1.519 bln
-2.2%
jan 1, 1991
70.228 bln
+2.85 bln
4.23%
jan 1, 1992
72.374 bln
+2.146 bln
3.06%
jan 1, 1993
67.349 bln
-5.025 bln
-6.94%
jan 1, 1994
63.097 bln
-4.252 bln
-6.31%
jan 1, 1995
56.41 bln
-6.687 bln
-10.6%
jan 1, 1996
65.633 bln
+9.223 bln
16.35%
jan 1, 1997
69.333 bln
+3.7 bln
5.64%
jan 1, 1998
73.538 bln
+4.205 bln
6.06%
jan 1, 1999
73.76 bln
+222.629 mln
0.3%
jan 1, 2000
70.849 bln
-2.911 bln
-3.95%
jan 1, 2001
74.302 bln
+3.453 bln
4.87%
jan 1, 2002
70.998 bln
-3.304 bln
-4.45%
jan 1, 2003
72.896 bln
+1.898 bln
2.67%
jan 1, 2004
80.978 bln
+8.082 bln
11.09%
jan 1, 2005
85.794 bln
+4.816 bln
5.95%
jan 1, 2006
99.141 bln
+13.347 bln
15.56%
jan 1, 2007
112.841 bln
+13.7 bln
13.82%
jan 1, 2008
131.347 bln
+18.506 bln
16.4%
jan 1, 2009
163.39 bln
+32.043 bln
24.4%
jan 1, 2010
170.88 bln
+7.49 bln
4.58%
jan 1, 2011
188.029 bln
+17.149 bln
10.04%
jan 1, 2012
207.504 bln
+19.475 bln
10.36%
jan 1, 2013
229.056 bln
+21.552 bln
10.39%
jan 1, 2014
239.333 bln
+10.276 bln
4.49%
jan 1, 2015
252.528 bln
+13.195 bln
5.51%
jan 1, 2016
253.889 bln
+1.361 bln
0.54%
Ranking of countries by current statistics by years


Comments: