29
/
en
AIzaSyAYiBZKx7MnpbEhh9jyipgxe19OcubqV5w
April 1, 2024
146546
Guinea-Bissau
GNB
true
2
1
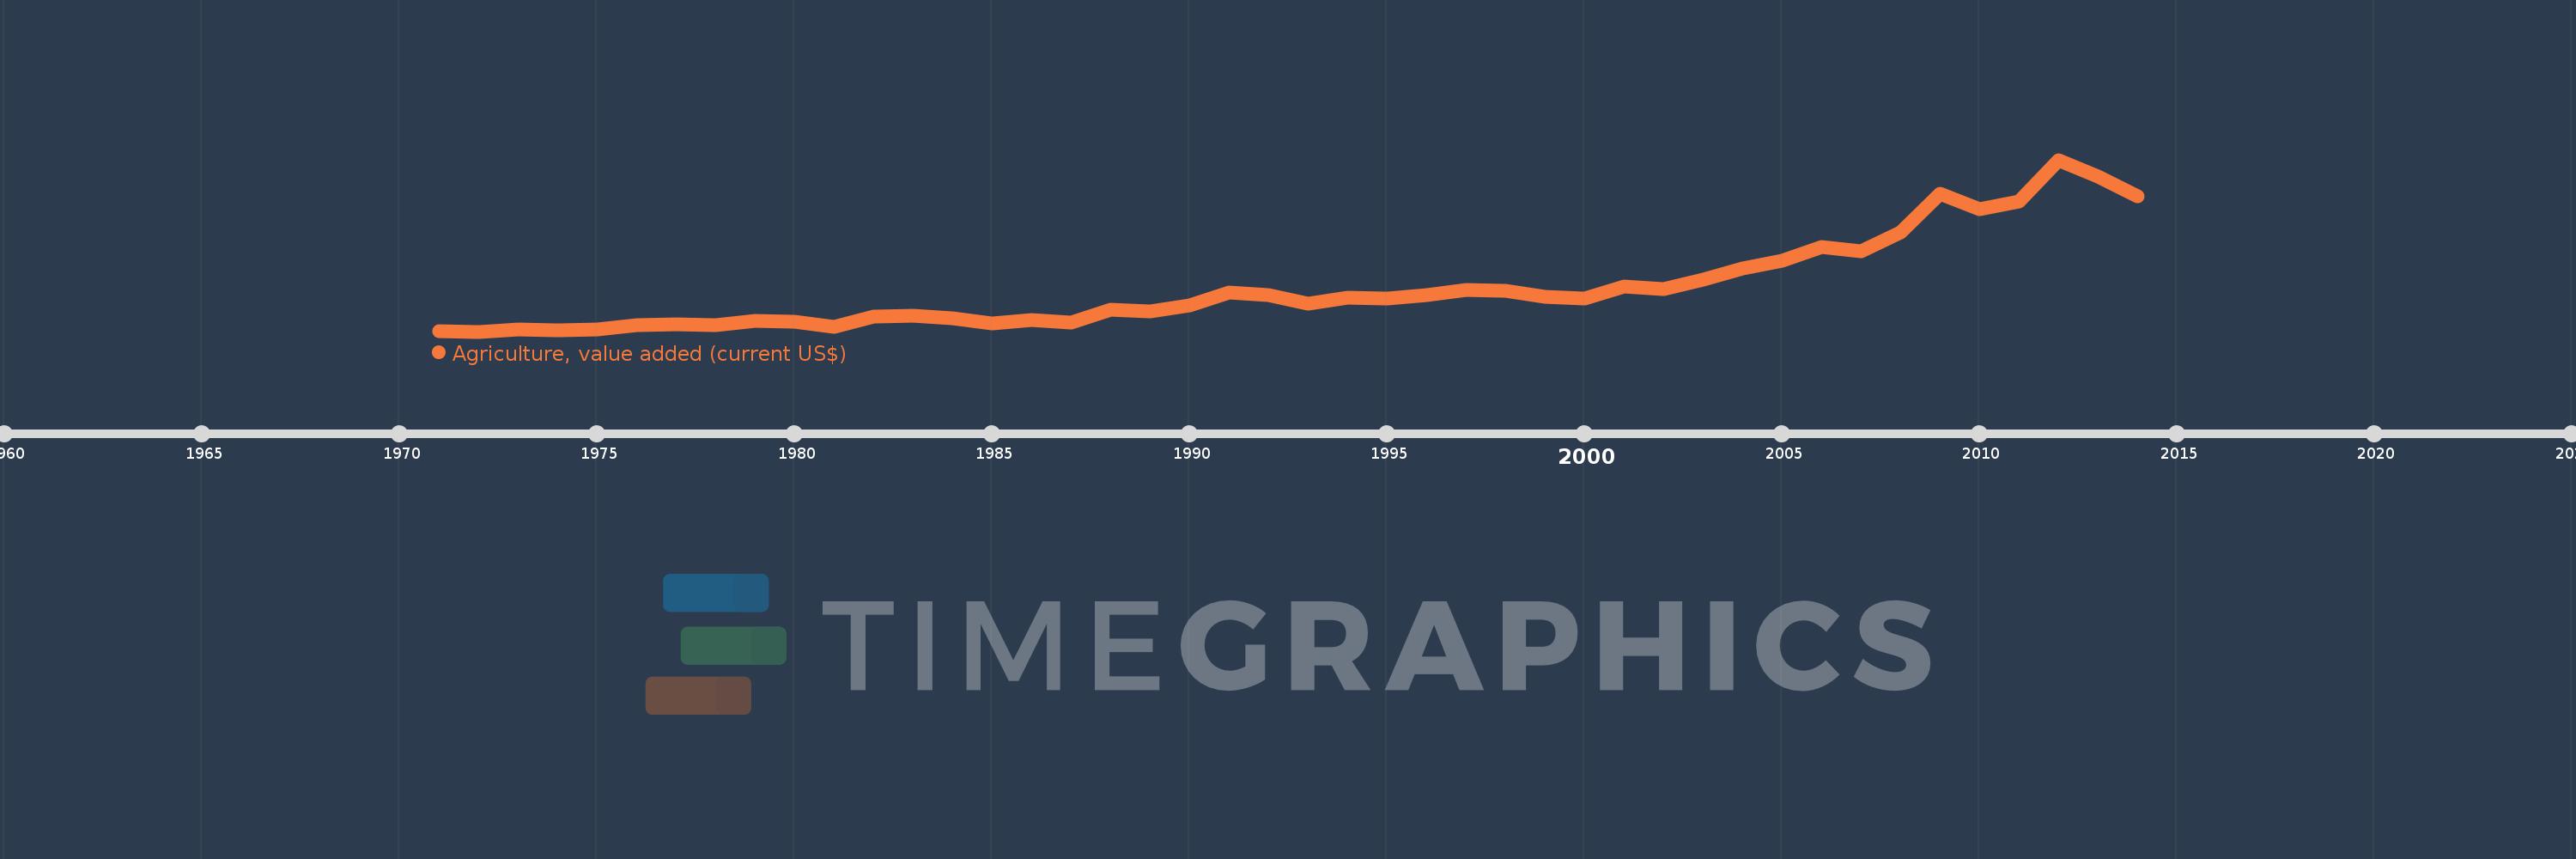
Agriculture, value added (current US$)
2014,2013,2012,2011,2010,2009,2008,2007,2006,2005,2004,2003,2002,2001,2000,1999,1998,1997,1996,1995,1994,1993,1992,1991,1990,1989,1988,1987,1986,1985,1984,1983,1982,1981,1980,1979,1978,1977,1976,1975,1974,1973,1972,1971
This statistics in other country:
AfghanistanAlbaniaAlgeriaAndorraAngolaAntigua and BarbudaArab WorldArgentinaArmeniaArubaAustraliaAustriaAzerbaijanBahamas, TheBahrainBangladeshBarbadosBelarusBelgiumBelizeBeninBermudaBhutanBoliviaBosnia and HerzegovinaBotswanaBrazilBrunei DarussalamBulgariaBurkina FasoBurundiCabo VerdeCambodiaCameroonCanadaCaribbean small statesCayman IslandsCentral African RepublicCentral Europe and the BalticsChadChileChinaColombiaComorosCongo, Dem. Rep.Congo, Rep.Costa RicaCote d'IvoireCroatiaCubaCyprusCzech RepublicDenmarkDjiboutiDominicaDominican RepublicEarly-demographic dividendEast Asia & PacificEast Asia & Pacific (excluding high income)East Asia & Pacific (IDA & IBRD countries)EcuadorEgypt, Arab Rep.El SalvadorEquatorial GuineaEritreaEstoniaEthiopiaEuro areaEurope & Central AsiaEurope & Central Asia (excluding high income)Europe & Central Asia (IDA & IBRD countries)European UnionFijiFinlandFragile and conflict affected situationsFranceFrench PolynesiaGabonGambia, TheGeorgiaGermanyGhanaGreeceGrenadaGuatemalaGuineaGuinea-BissauGuyanaHeavily indebted poor countries (HIPC)High incomeHondurasHong Kong SAR, ChinaHungaryIBRD onlyIcelandIDA & IBRD totalIDA blendIDA onlyIDA totalIndiaIndonesiaIran, Islamic Rep.IraqIrelandItalyJamaicaJapanJordanKazakhstanKenyaKiribatiKorea, Rep.KosovoKuwaitKyrgyz RepublicLao PDRLate-demographic dividendLatin America & Caribbean Latin America & Caribbean (excluding high income)Latin America & the Caribbean (IDA & IBRD countries)LatviaLeast developed countries: UN classificationLebanonLesothoLiberiaLibyaLithuaniaLow & middle incomeLow incomeLower middle incomeLuxembourgMacao SAR, ChinaMacedonia, FYRMadagascarMalawiMalaysiaMaldivesMaliMaltaMarshall IslandsMauritaniaMauritiusMexicoMicronesia, Fed. Sts.Middle East & North AfricaMiddle East & North Africa (excluding high income)Middle East & North Africa (IDA & IBRD countries)Middle incomeMoldovaMongoliaMontenegroMoroccoMozambiqueMyanmarNamibiaNepalNetherlandsNew CaledoniaNew ZealandNicaraguaNigerNigeriaNorth AmericaNorwayOECD membersOmanOther small statesPakistanPalauPanamaPapua New GuineaParaguayPeruPhilippinesPolandPortugalPost-demographic dividendPre-demographic dividendPuerto RicoQatarRomaniaRussian FederationRwandaSamoaSao Tome and PrincipeSaudi ArabiaSenegalSerbiaSeychellesSierra LeoneSingaporeSlovak RepublicSloveniaSmall statesSolomon IslandsSouth AfricaSouth AsiaSouth Asia (IDA & IBRD)SpainSri LankaSt. Kitts and NevisSt. LuciaSt. Vincent and the GrenadinesSub-Saharan Africa Sub-Saharan Africa (excluding high income)Sub-Saharan Africa (IDA & IBRD countries)SudanSurinameSwazilandSwedenSwitzerlandSyrian Arab RepublicTajikistanTanzaniaThailandTimor-LesteTogoTongaTrinidad and TobagoTunisiaTurkeyTurkmenistanTuvaluUgandaUkraineUnited Arab EmiratesUnited KingdomUnited StatesUpper middle incomeUruguayUzbekistanVanuatuVenezuela, RBVietnamWest Bank and GazaWorldYemen, Rep.ZambiaZimbabwe Timeline:
This timeline shows a graph from 1971 to 2014 of Guinea-Bissau. No data until 1970. Number of actual observations by date: 44.
Source name:
World Development Indicators
Source organization:
World Bank national accounts data, and OECD National Accounts data files.
Categories, topics:
Agriculture & Rural Development, Economy & Growth
Last updated:
apr 23, 2017
Indicators value changes by year
Minimum:
35.226 mln
jan 1, 1972
Maximum:
491.165 mln
jan 1, 2012
At the date of observation
Value
Absolute change
Change from previous value
jan 1, 1971
37.363 mln
+37.363 mln
0.0%
jan 1, 1972
35.226 mln
-2.138 mln
-5.72%
jan 1, 1973
40.151 mln
+4.926 mln
13.98%
jan 1, 1974
38.326 mln
-1.825 mln
-4.55%
jan 1, 1975
40.873 mln
+2.547 mln
6.65%
jan 1, 1976
52.065 mln
+11.192 mln
27.38%
jan 1, 1977
54.046 mln
+1.982 mln
3.81%
jan 1, 1978
53.064 mln
-982.059K
-1.82%
jan 1, 1979
63.312 mln
+10.248 mln
19.31%
jan 1, 1980
61.152 mln
-2.16 mln
-3.41%
jan 1, 1981
46.691 mln
-14.461 mln
-23.65%
jan 1, 1982
76.238 mln
+29.547 mln
63.28%
jan 1, 1983
77.398 mln
+1.161 mln
1.52%
jan 1, 1984
69.424 mln
-7.974 mln
-10.3%
jan 1, 1985
57.216 mln
-12.208 mln
-17.59%
jan 1, 1986
66.875 mln
+9.659 mln
16.88%
jan 1, 1987
58.926 mln
-7.949 mln
-11.89%
jan 1, 1988
93.018 mln
+34.092 mln
57.86%
jan 1, 1989
88.785 mln
-4.234 mln
-4.55%
jan 1, 1990
103.713 mln
+14.929 mln
16.81%
jan 1, 1991
138.902 mln
+35.189 mln
33.93%
jan 1, 1992
131.857 mln
-7.045 mln
-5.07%
jan 1, 1993
108.256 mln
-23.601 mln
-17.9%
jan 1, 1994
125.179 mln
+16.923 mln
15.63%
jan 1, 1995
123.135 mln
-2.043 mln
-1.63%
jan 1, 1996
131.549 mln
+8.413 mln
6.83%
jan 1, 1997
146.69 mln
+15.141 mln
11.51%
jan 1, 1998
144.066 mln
-2.624 mln
-1.79%
jan 1, 1999
126.798 mln
-17.268 mln
-11.99%
jan 1, 2000
123.537 mln
-3.261 mln
-2.57%
jan 1, 2001
154.469 mln
+30.931 mln
25.04%
jan 1, 2002
147.136 mln
-7.333 mln
-4.75%
jan 1, 2003
173.956 mln
+26.82 mln
18.23%
jan 1, 2004
201.731 mln
+27.775 mln
15.97%
jan 1, 2005
223.022 mln
+21.291 mln
10.55%
jan 1, 2006
258.962 mln
+35.94 mln
16.11%
jan 1, 2007
247.947 mln
-11.015 mln
-4.25%
jan 1, 2008
298.17 mln
+50.223 mln
20.26%
jan 1, 2009
400.645 mln
+102.475 mln
34.37%
jan 1, 2010
360.896 mln
-39.749 mln
-9.92%
jan 1, 2011
380.183 mln
+19.287 mln
5.34%
jan 1, 2012
491.165 mln
+110.982 mln
29.19%
jan 1, 2013
445.869 mln
-45.296 mln
-9.22%
jan 1, 2014
395.342 mln
-50.526 mln
-11.33%
Ranking of countries by current statistics by years


Comments: