29
/
en
AIzaSyAYiBZKx7MnpbEhh9jyipgxe19OcubqV5w
April 1, 2024
90761
Brazil
BRA
true
2
1
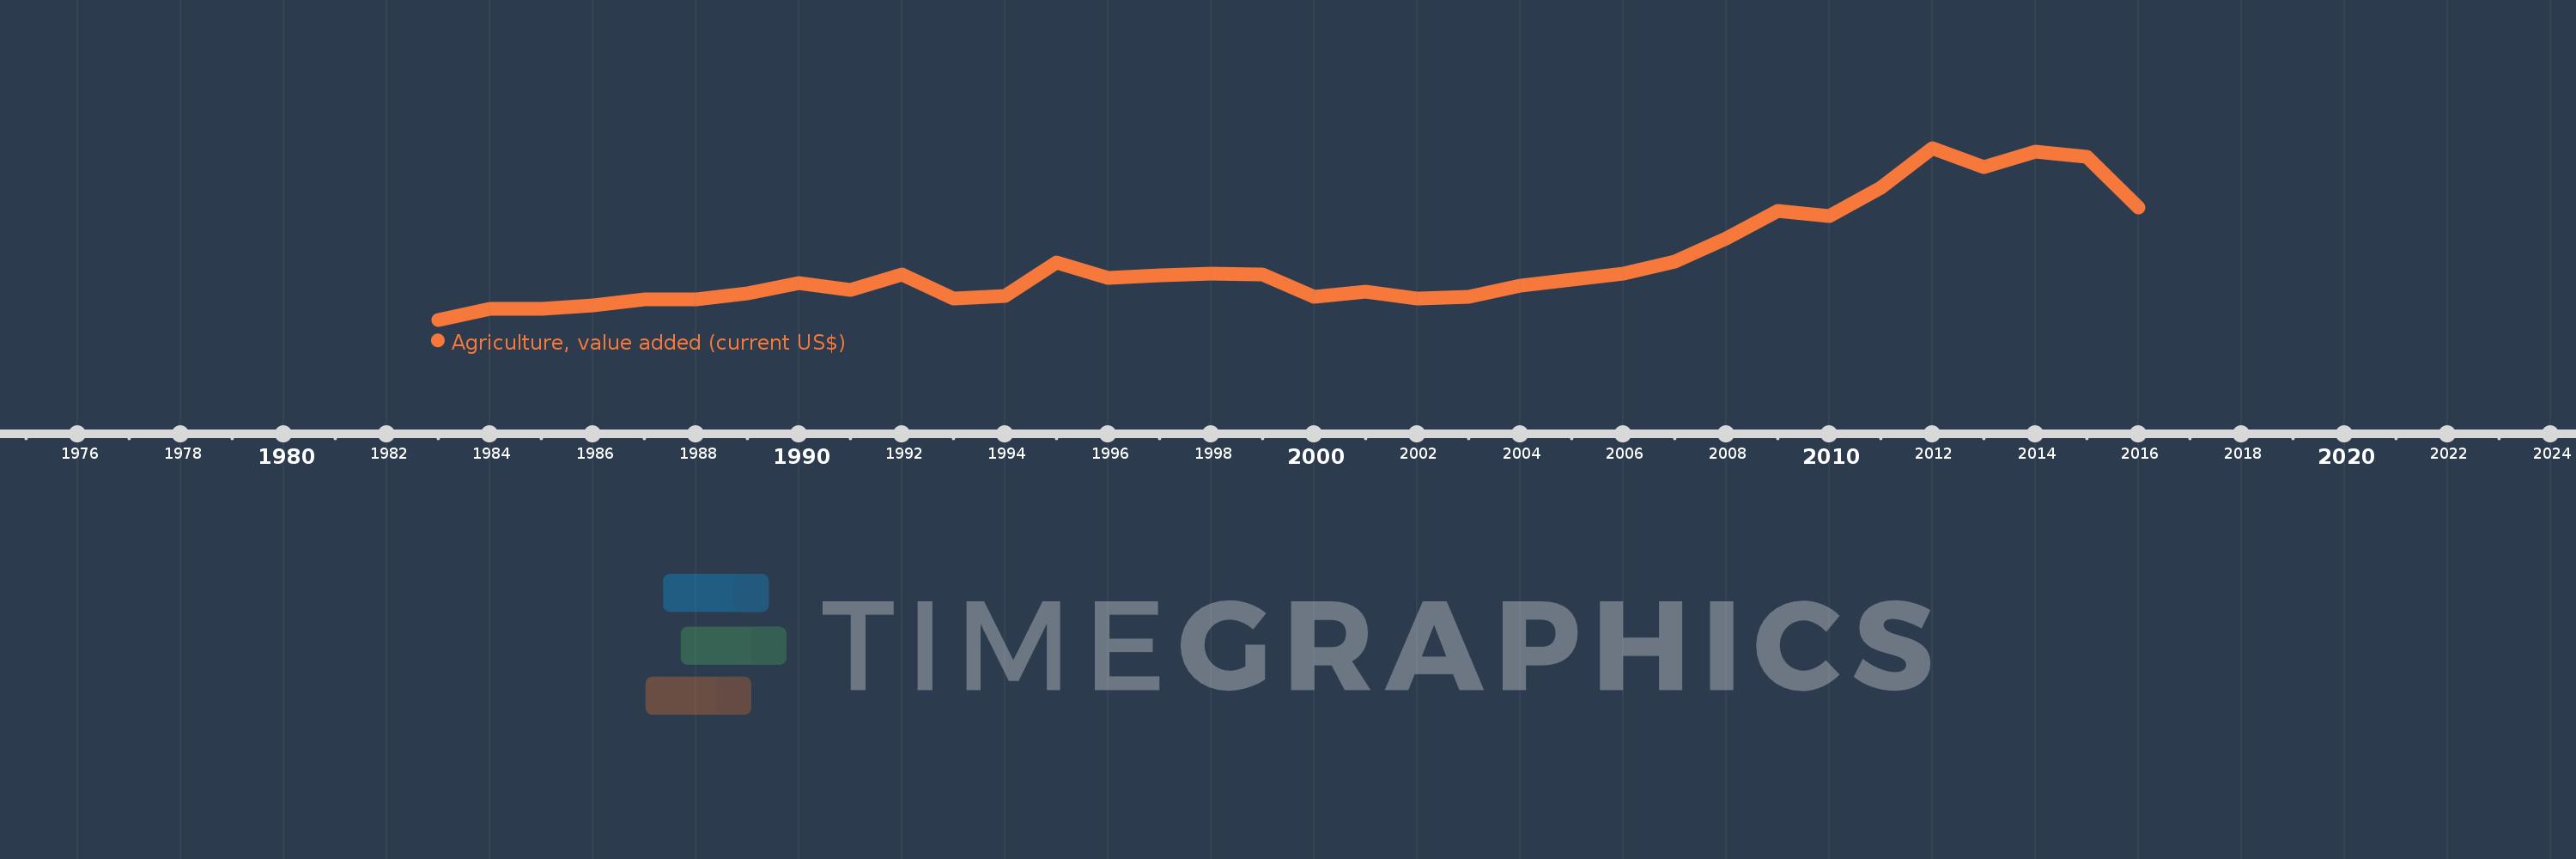
Agriculture, value added (current US$)
2016,2015,2014,2013,2012,2011,2010,2009,2008,2007,2006,2005,2004,2003,2002,2001,2000,1999,1998,1997,1996,1995,1994,1993,1992,1991,1990,1989,1988,1987,1986,1985,1984,1983
This statistics in other country:
AfghanistanAlbaniaAlgeriaAndorraAngolaAntigua and BarbudaArab WorldArgentinaArmeniaArubaAustraliaAustriaAzerbaijanBahamas, TheBahrainBangladeshBarbadosBelarusBelgiumBelizeBeninBermudaBhutanBoliviaBosnia and HerzegovinaBotswanaBrazilBrunei DarussalamBulgariaBurkina FasoBurundiCabo VerdeCambodiaCameroonCanadaCaribbean small statesCayman IslandsCentral African RepublicCentral Europe and the BalticsChadChileChinaColombiaComorosCongo, Dem. Rep.Congo, Rep.Costa RicaCote d'IvoireCroatiaCubaCyprusCzech RepublicDenmarkDjiboutiDominicaDominican RepublicEarly-demographic dividendEast Asia & PacificEast Asia & Pacific (excluding high income)East Asia & Pacific (IDA & IBRD countries)EcuadorEgypt, Arab Rep.El SalvadorEquatorial GuineaEritreaEstoniaEthiopiaEuro areaEurope & Central AsiaEurope & Central Asia (excluding high income)Europe & Central Asia (IDA & IBRD countries)European UnionFijiFinlandFragile and conflict affected situationsFranceFrench PolynesiaGabonGambia, TheGeorgiaGermanyGhanaGreeceGrenadaGuatemalaGuineaGuinea-BissauGuyanaHeavily indebted poor countries (HIPC)High incomeHondurasHong Kong SAR, ChinaHungaryIBRD onlyIcelandIDA & IBRD totalIDA blendIDA onlyIDA totalIndiaIndonesiaIran, Islamic Rep.IraqIrelandItalyJamaicaJapanJordanKazakhstanKenyaKiribatiKorea, Rep.KosovoKuwaitKyrgyz RepublicLao PDRLate-demographic dividendLatin America & Caribbean Latin America & Caribbean (excluding high income)Latin America & the Caribbean (IDA & IBRD countries)LatviaLeast developed countries: UN classificationLebanonLesothoLiberiaLibyaLithuaniaLow & middle incomeLow incomeLower middle incomeLuxembourgMacao SAR, ChinaMacedonia, FYRMadagascarMalawiMalaysiaMaldivesMaliMaltaMarshall IslandsMauritaniaMauritiusMexicoMicronesia, Fed. Sts.Middle East & North AfricaMiddle East & North Africa (excluding high income)Middle East & North Africa (IDA & IBRD countries)Middle incomeMoldovaMongoliaMontenegroMoroccoMozambiqueMyanmarNamibiaNepalNetherlandsNew CaledoniaNew ZealandNicaraguaNigerNigeriaNorth AmericaNorwayOECD membersOmanOther small statesPakistanPalauPanamaPapua New GuineaParaguayPeruPhilippinesPolandPortugalPost-demographic dividendPre-demographic dividendPuerto RicoQatarRomaniaRussian FederationRwandaSamoaSao Tome and PrincipeSaudi ArabiaSenegalSerbiaSeychellesSierra LeoneSingaporeSlovak RepublicSloveniaSmall statesSolomon IslandsSouth AfricaSouth AsiaSouth Asia (IDA & IBRD)SpainSri LankaSt. Kitts and NevisSt. LuciaSt. Vincent and the GrenadinesSub-Saharan Africa Sub-Saharan Africa (excluding high income)Sub-Saharan Africa (IDA & IBRD countries)SudanSurinameSwazilandSwedenSwitzerlandSyrian Arab RepublicTajikistanTanzaniaThailandTimor-LesteTogoTongaTrinidad and TobagoTunisiaTurkeyTurkmenistanTuvaluUgandaUkraineUnited Arab EmiratesUnited KingdomUnited StatesUpper middle incomeUruguayUzbekistanVanuatuVenezuela, RBVietnamWest Bank and GazaWorldYemen, Rep.ZambiaZimbabwe Timeline:
This timeline shows a graph from 1983 to 2016 of Brazil. No data until 1982. Number of actual observations by date: 34.
Source name:
World Development Indicators
Source organization:
World Bank national accounts data, and OECD National Accounts data files.
Categories, topics:
Agriculture & Rural Development, Economy & Growth
Last updated:
apr 23, 2017
Indicators value changes by year
Minimum:
14.818 bln
jan 1, 1983
Maximum:
113.596 bln
jan 1, 2012
At the date of observation
Value
Absolute change
Change from previous value
jan 1, 1983
14.818 bln
+14.818 bln
0.0%
jan 1, 1984
20.949 bln
+6.131 bln
41.37%
jan 1, 1985
20.956 bln
+6.758 mln
0.03%
jan 1, 1986
22.959 bln
+2.003 bln
9.56%
jan 1, 1987
26.445 bln
+3.486 bln
15.18%
jan 1, 1988
26.429 bln
-15.98 mln
-0.06%
jan 1, 1989
30.197 bln
+3.768 bln
14.26%
jan 1, 1990
35.927 bln
+5.73 bln
18.97%
jan 1, 1991
31.751 bln
-4.176 bln
-11.62%
jan 1, 1992
40.927 bln
+9.176 bln
28.9%
jan 1, 1993
27.16 bln
-13.767 bln
-33.64%
jan 1, 1994
28.735 bln
+1.575 bln
5.8%
jan 1, 1995
47.643 bln
+18.908 bln
65.8%
jan 1, 1996
38.744 bln
-8.899 bln
-18.68%
jan 1, 1997
40.552 bln
+1.809 bln
4.67%
jan 1, 1998
41.378 bln
+825.367 mln
2.04%
jan 1, 1999
41.028 bln
-349.546 mln
-0.84%
jan 1, 2000
27.847 bln
-13.181 bln
-32.13%
jan 1, 2001
31.136 bln
+3.289 bln
11.81%
jan 1, 2002
26.855 bln
-4.281 bln
-13.75%
jan 1, 2003
27.812 bln
+956.992 mln
3.56%
jan 1, 2004
34.433 bln
+6.621 bln
23.8%
jan 1, 2005
37.919 bln
+3.486 bln
10.12%
jan 1, 2006
41.471 bln
+3.553 bln
9.37%
jan 1, 2007
48.404 bln
+6.933 bln
16.72%
jan 1, 2008
61.708 bln
+13.304 bln
27.48%
jan 1, 2009
77.463 bln
+15.755 bln
25.53%
jan 1, 2010
74.629 bln
-2.834 bln
-3.66%
jan 1, 2011
90.912 bln
+16.283 bln
21.82%
jan 1, 2012
113.596 bln
+22.685 bln
24.95%
jan 1, 2013
102.757 bln
-10.839 bln
-9.54%
jan 1, 2014
111.447 bln
+8.689 bln
8.46%
jan 1, 2015
108.27 bln
-3.177 bln
-2.85%
jan 1, 2016
79.241 bln
-29.029 bln
-26.81%
Ranking of countries by current statistics by years


Comments: